Data Inspired Insights

Month: February 2021

D3.js: Adding a colored background to a text element

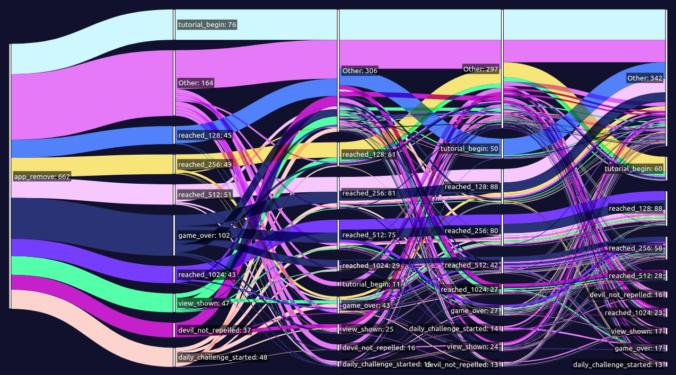
There is no language I find quite so humbling as D3.js. Just when I think I understand it, I get stumped for a whole day trying to do something as simple as adding a colored background to a text element so the letters are readable against the rainbow-colored monstrosity sitting behind it. Well, if you found this post amongst the sea of woefully inadequate advice that I had to wade through, hopefully you have finally found your answer. In short, we are going to look at how to use D3.js to:

  1. Add a rect element for each text element in a dataset.
  2. Set the size of that rect element to match the corresponding text element.
  3. Ensure the rect element sits behind the text element, not on top of it.

Note: for this explainer we are working with D3.js version 6.

Continue reading
Pandas: Joining tables

This article is part of a series of practical guides for using the Python data processing library pandas. To see view all the available parts, click here.

One of the most fundamental concepts in data science and data work in general is joining two tables together based on some shared column or index. In SQL it is a JOIN. In Excel it is INDEX-MATCH or VLOOKUP. In pandas, two methods are available to join tables together: merge and join. We will look at both of those methods in this guide.

Continue reading

Pandas: How to Pivot data

This article is part of a series of practical guides for using the Python data processing library pandas. To see view all the available parts, click here.

When I was starting out with pandas, I was coming from an Excel and SQL background. Having spent a solid 8 years with Excel as my primary data munging and modeling tool, I was very comfortable using pivot tables, a tool I found extremely powerful and later discovered are strangely controversial. My workflow started to involve pivot tables so regularly that my SQL queries were often written to extract data in a format that would make it simpler to aggregate in a pivot table.

Naturally, when I started learning pandas, one of the first things I wanted to learn was “how can I recreate the functionality of an Excel pivot table in pandas”? In this guide we will look at several ways to do just that.

Continue reading

© 2025 Brett Romero

Theme by Anders NorenUp ↑