Data Inspired Insights

Category: Visualization

D3.js: Adding a colored background to a text element

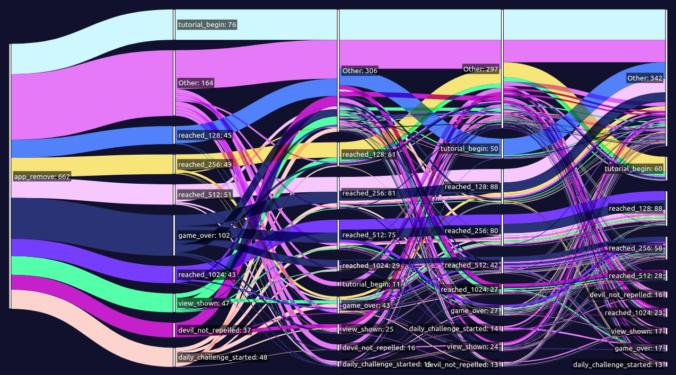
There is no language I find quite so humbling as D3.js. Just when I think I understand it, I get stumped for a whole day trying to do something as simple as adding a colored background to a text element so the letters are readable against the rainbow-colored monstrosity sitting behind it. Well, if you found this post amongst the sea of woefully inadequate advice that I had to wade through, hopefully you have finally found your answer. In short, we are going to look at how to use D3.js to:

  1. Add a rect element for each text element in a dataset.
  2. Set the size of that rect element to match the corresponding text element.
  3. Ensure the rect element sits behind the text element, not on top of it.

Note: for this explainer we are working with D3.js version 6.

Continue reading

JSONify It – CSV to JSON Converter

Go to JSONify It

For those who have some experience in creating visualizations, particularly online visualizations using JavaScript and libraries such as D3.js, one thing that you will often come across is the need to convert your data. Typically this need will arise because the data you receive or collect will be in a human-friendly format such as an Excel spreadsheet, and in order for you to use it for the visualization you will need that data in JSON format. Annoyingly, this will often be just a one time conversion, meaning writing a stand alone script to do the conversion often seems like overkill.

Continue reading

© 2024 Brett Romero

Theme by Anders NorenUp ↑