Data Inspired Insights

Tag: Government (Page 1 of 2)

The argument for taxing capital gains at the full rate

Politicians, both in Australia and the US, when asked how they will find the money to fund various policy proposals, often resort to the magic pudding of funding sources that is “closing the loop holes in the tax code”. After all, who can argue with stopping tax dodgers rorting the system? But as Megan McArdle recently pointed out, raising any significant revenue from closing loop holes requires denying deductions for things that a lot of middle and lower class people also benefit from. This includes, among other things, deductions for mortgage interest, employee sponsored health insurance, lower (or no) tax on money set aside for pensions and no tax on capital gains when the family house is sold.[1]

Broadly, I agree with McArdle’s point. The public, in general, are far too easily convinced by simplistic arguments about changes to taxation – as if after decades of tax policy changes there are still simple ways to increase revenues without anyone suffering. Any changes made at this point are going to cause winners and losers, and often, the people intended to be the losers (usually the rich) are less affected than some other group that also happened to be taking advantage of a particular deduction.

That said, there is one point, addressed breifly in McArdle’s article, that I thought deserved greater attention – the concessional taxation of capital gains. In the list provided in the article, it was the second most expensive tax deduction in the US at $85 billion a year[2]. You see, for a while now I have been somewhat of a closet skeptic of the need for lower tax rates on capital income (i.e. capital gains and dividends). The reason for my skepticism is two fold:

  1. Everyone seems to be in agreement that concessional rates for capital income are absolutely necessary, but no one seems to really understand why.
  2. Capital income makes up a much larger percentage of income for the wealthy than for the lower or middle class. When you hear that story about billionaire Warren Buffet paying a lower rate of tax than his secretary, it is because of the low rate of tax on capital income.

So, now that I am finally voicing my skepticism, this article is going to look at what arguments are made for lower tax rates on capital income (focusing on capital gains for individuals) and whether those arguments hold water.

Why are capital gains taxed at a lower rate?

Once you start digging, you quickly find there is a range of arguments (of variable quality) being made for why capital gains should be taxed at a lower rate. These arguments can largely be grouped into the following broad categories:

  1. Inflation
  2. Lock-In
  3. Double Taxation
  4. Capital is Mobile
  5. The Consumption – Savings tradeoff

Inflation

Taxing capital gains implies taxing the asset holder for any increases in the price of that asset. In an economy where inflation exists (i.e. every economy) this means you are taxing increases in the price of the asset due to inflation, as well as any increase in the value of the asset itself. Essentially, even if you had an asset which had only increased in value at the exact same rate as inflation (i.e. the asset was tradable for the same amount of goods as when you bought it), you would still have to pay capital gains tax.

The inflation argument although legitimate, is relatively easy to legislate around by allowing asset holders to adjust up the cost base of their assets by the inflation rate each year.

Lock In

‘Lock-in’ is the idea that investors, to avoid paying capital gains tax, will stop selling their assets. An investor holding onto assets to avoid tax implies they are being incentivized, through the tax system, to invest suboptimally – something economists really dislike. However, as far as ‘lock-in’ would occur, it cannot be considered anything other than an irrational reaction. Holding onto assets does not avoid tax, it only delays it, and given inflation is factored into the asset price (as discussed above), there is not even the benefit of time reducing the tax burden. The bottom line is this – to pay more capital gains tax, there must be larger capital gains. That is, even if the capital gains tax rate was 99%, an investor would still be better off making larger capital gains than smaller ones.

The other point to remember when it comes to ‘lock-in’ is that in both the US and Australia, the lower rate of capital gains tax only applies to assets held for more than a year. That means if ‘lock-in’ exists, it is already a major problem. Because asset holders can access a lower rate of tax by holding an asset for a year, they are already strongly incentivized to hold onto their underperforming assets longer than is optimal to access the concessional tax rate. In fact, increasing the long-term capital gains tax rate to the same level as the short-term rate should actually reduce lock-in by removing this incentive.

Double Taxation

The double taxation argument is a genuine concern for economists. The double tax situation arises because companies already pay tax on their profits. Taxing those profits in the hands of investors again, either as capital gains (on that company’s stock) or dividends, implies some high marginal tax rates on investment. This is one of the main reasons capital income is taxed at low rates in most countries.

Ideally, to avoid this situation, the tax code would be simplified by removing company tax altogether, as McArdle herself has argued in the past. However, we should probably both accept that, at best, the removal of corporate tax is a long way away. Nevertheless, this idea can form the basis for policies that achieve similar goals without the political issue of trying to sell the removal of corporate tax.

For dividends, for example, double taxation can be avoided by providing companies with a deduction for the value of dividends paid out to investors. Investors would then pay their full marginal tax rate on the dividends, more than replacing the lost company tax revenues.

Preventing double taxation of capital gains is a little more complicated, but the answer may lie in setting up a quarantined investment pool that companies can move profits into. Profits moved into this pool would not be subject to tax and, once in the pool, the money could only be used for certain legitimate investment activities. This would effectively remove taxation on profits going toward genuine reinvestment, as opposed to fattening bonus checks.

The overall point here is not that I have the perfect policy to avoid double taxation of company profits, but that there are other worthwhile avenues worth exploring that are not simply giving huge tax breaks to wealthy investors.

Capital is Mobile

This is one of the two arguments McArdle briefly mentions in her article. The ‘capital is mobile argument’ is the argument that if we tax wealthy investors too much, they will do a John Galt, take their money and go to another country that won’t be so “mean” to them.

When it comes to moving money offshore, obviously, not everyone is in a position to make the move. Pension funds and some investment vehicles cannot simply move country. Companies and some other investment vehicles do not receive a capital gains tax discount currently, meaning raising tax rates for capital gains for individuals would not impact them at all. Finally, even for investors that would be affected and do have the means, a hike in the capital gains rate does not automatically move all their investments below the required rate of return.

This argument also overlooks the vast array of complications in moving money offshore and the risks involved with that action. Moving assets offshore exposes investors to new risks such as exchange rate risk[3] and sovereign risk[4]. It also significantly complicates the administrative, compliance and legal burden the investor has to manage.

However, even if we concede that yes, some money would move offshore as a result of higher taxes on capital gains, let’s look at the long term picture. What is the logical end point for a world where each country employs a policy of attracting wealthy investors by lowering taxes on capital? A world where no country taxes capital!

Of course, there are alternatives. Countries (and developed countries in particular should take the lead on this) can stop chasing the money through tax policy and focus on other ways of competing for investment capital. Education, productivity, infrastructure, network effects, low administrative and compliance costs are all important factors in the assessment of how attractive a location is for investors. California, for example, is not the home of Silicon Valley because it has low taxes on capital. Pulling the ‘lower taxes to attract investment’ lever is essentially the lazy option.

Consumption vs. Savings

The second point raised by McArdle is the argument that if you reduce the returns from investing (by raising tax rates), people will substitute away from saving and investing (future consumption) and instead spend the money now (immediate consumption).

The way to think of this is not of someone cashing in all their assets and going on a spending spree because the capital gains tax rate increased. That is extremely unlikely to happen and would actually make no sense. The change will come on the margin – because the returns on investment have decreased slightly (for certain asset types), there will be slightly less incentive to save and invest. As a result, over time, less money ends up being invested and is instead consumed.

But let’s consider who would be affected. If we think about the vast majority of people, their only exposure to capital gains is through their pension fund and the property they live in, neither of which would be affected by increasing the individual capital gains tax rate. Day traders, high frequency traders and anyone holding stocks for less than a year on average would also be unaffected. Most investors in start-ups do so through investment vehicles that are, again, not subject to individual capital gains tax[5]. That leaves two main groups of investors impacted by an increase in the capital gains tax rate for individuals:

  1. Property investors
  2. High net worth individual investors

Given property investing is not what most people are thinking about when concerns about capital gains tax rates reducing investment are raised, let’s focus on high wealth investors.

The key issue when considering how these investors would be affected by an increase in the capital gains tax rate is identifying what drives them to invest in the first place. Many of them literally have more money than they could ever spend, which means their investment decisions cannot be driven by a desire for future consumption. Many of their kids will never want for anything either, so even ensuring the financial security of their kids is not an issue. The only real motivation that can be left is simply status, power and prestige. Or as the tech industry has helpfully rebadged it – ‘making the world a better place.’

If that is the motivation though, does a rise in the capital gains tax rate change that motivation?

To my mind, the answer to that question is ‘No’. These people are already consuming everything they want, or in economic parlance, their desire for goods and services has been satiated. They will gain no additional pleasure (‘utility’) from diverting savings to consumption, so there is no incentive to do so even when the gains from investing are reduced.

Of course, there are exceptions, and it is quite possible (even likely) that there are high net worth individuals who live somewhat frugally and as a result of this policy change would really start splashing out. The question is how significant is this amount of lost investment, and does the loss of that investment capital outweigh the cost to society more widely of a deduction that flows almost entirely to the wealthy.

The Research

Putting this piece together, I have studiously attempted to avoid confirmation bias.[6] Despite the fact that I would benefit personally from lower tax rates on capital gains (well, at least I would if my portfolio would increase in value for a change), I definitely want to believe that aligning capital gains tax rates with the tax rates on normal income would raise significant amounts of tax, mostly from wealthy individuals, with few negative consequences.

In my attempts to avoid confirmation bias, I have deliberately searched for articles and research papers that provide empirical evidence that lower capital gains tax rates were found to lead to higher rates of savings, investment and/or economic growth. I have not been able to find any. There were some papers that claimed to show that decreasing capital gains tax rates actually increased tax revenue, but reading the Australian section of this paper (about which I have some knowledge), it quickly became clear this conclusion had been reached using a combination of cherry picking dates[7] and leaving out important details.[8]

I did also find some papers that, through theoretical models, concluded higher taxes on capital income would cause a range of negative impacts. But the problem with papers that rely on theoretical models is that for every paper based on a theoretical model that concludes “… a capital income tax… reduces the number of entrepreneurs…” there is another paper based on a theoretical model that concludes “… higher capital income taxes lead to faster growth…

Leaving research aside, there were a number of articles supporting the lowering or removing of capital income taxes. The problem is they all recite the same old arguments (“it will cause lock-in!”) and tend to come from a very specific type of institution. Without going too much into what type of institution, let me just list where almost all the material I located was coming from (directly or indirectly):

Even when I found an article from a less partisan source (Forbes), it turned out to be written by a senior fellow at the Cato Institute, and was rebutted by another article in the same publication.

Of course we should not ignore what people say because they work for a certain type of institution – just because they have an agenda does not mean they are wrong. In fact, it stands to reason that organizations interested in reducing taxation and limiting government would research this particular topic. The problem is that if there are genuine arguments being made, they are being lost amongst the misleading and the nonsensical.

Take this argument for lower taxes on capital as an example. First there is a chart taken from this textbook:

Capital per Worker vs. Income per Worker

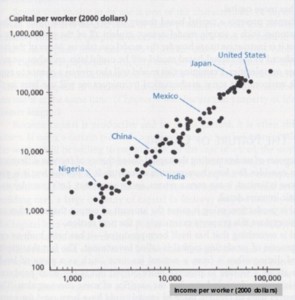
The article then uses this as evidence to suggest more capital equals more income for workers. As straightforward as this seems, what this conclusion misleadingly skips over is:

  • income per worker is not equivalent to income for workers, and
  • almost all the countries towards the top right hand corner of this chart (i.e. the rich ones) got to their highly capital intensive states despite having high taxes on capital.

A Change in Attitude?

The timing of this article seems to have conveniently coincided with the announcement by Hilary Clinton of a new policy proposal – a ‘Fair Share Surcharge’. In short, the surcharge would be a 4% tax on all income above $5 million, regardless of the source. Matt Yglesias has done a good job of outlining the details in this article if you are interested.

The interesting aspect of this policy is, given the lower rate of tax typically applied to dividends and capital gains, it is a larger percentage increase in taxes on capital income than wage income. Of course, unless something major changes, this policy is very unlikely to make it past Congress and so may simply be academic, but at least it shows one side of politics may be starting to question the idea that taxes on capital should always be lower.

The Data

Finally, I want to finish up with a few charts. The charts below show how various economic indicators changed as various changes were made to the rate of capital gains tax, historically and across countries. Please note, these charts should not be taken as conclusive evidence one way or the other. The curse of economics is the inability to know (except in rare circumstances) what would have happened if a tax rate had not been raised, or if an interest rate rise had been postponed. The same applies with changes to the capital gains tax rate. Without knowing what would have happened if the capital gains tax rate had not been changed, we cannot draw firm conclusions as to what the result of that change was.

However, what we can see is that the indicators shown below do not seem to be significantly affected by changes in the capital gains tax rate, one way or the other – the effects appear to be drowned out by larger changes in the economy. That could be considered a conclusion in itself.

Chart1 – Maximum Long Term CGT Rate vs. Personal Savings rate, US 1959 to 2014

Chart 2 – Maximum Long Term CGT Rate vs. Annual GDP Growth, US 1961 to 2014

Chart 3 – Maximum Long Term CGT Rate vs. Gross Savings, Multiple Countries, 2011-2015 Average

Gross savings are calculated as gross national income less total consumption, plus net transfers. This amount is then divided by GDP (the overall size of the economy to normalize the value across countries.

Chart 4 – Maximum Long Term CGT Rate vs. Gross Fixed Capital Formation, Multiple Countries, 2011-2015 Average

Gross fixed capital formation is money invested in assets such as land, machinery, buildings or infrastructure. For the full definition, please see here. This amount is then divided by GDP (the overall size of the economy to normalize the value across countries.

Chart 5 – Maximum Long Term CGT Rate vs. Gini Index, 2011-2015 Average

The Gini index is a measure of income inequality within a country. A Gini index of 100 represents a country in which one person receives all of the income (i.e. total inequality). An index of 0 represents total equality.


[1] Interestingly, two of these four deductions (mortgage interest and employee sponsored health insurance) will be completely foreign to Australians.

[2] A similar policy (50% tax discount for capital gains) in Australia costs around AUD$6-7 billion per year.

[3] The risk that the exchange rate changes and has an adverse impact on the value of your investments.

[4] The risk that the government of the country you are investing in will change the rules in such a way to hurt your investments.

[5] Capital Gains Tax Policy Toward Entrepreneurship, James M. Poterba, National Tax Journal, Vol. 42, No. 3, Revenue Enhancement and Other Word Games: When is it a Tax? (September, 1989), pp. 375-389

[6] Confirmation basis is the tendency of people, consciously or subconsciously, to disregard or discount evidence that disagrees with their preconceived notions while perceiving evidence that confirms those notions as more authoritative.

[7] “After Australian CGT rates for individuals were cut by 50% in 1999 revenue from individuals grew strongly and the CGT share of tax revenue nearly doubled over the subsequent nine years.” Note the carefully selected time period includes the huge run up in asset prices from 2000 to 2007 and avoids the 2008 financial crisis, which caused huge declines in CGT revenues.

[8] “Individuals enjoyed a larger discount under the 1999 reforms than superannuation funds (50% versus 33%), yet yielded a larger increase in CGT payable.” This neglects to mention that even after the discounts were applied, the rate for of capital gains tax for almost all individuals was still higher than for superannuation funds.

Should the Wealthy be able to pay for Better Healthcare?

Commenting on an article on reddit.com, I recently got into an argument[1] with someone about healthcare and more specifically the role of private healthcare. The article was this NY times piece that talks about how US hospitals provide a range of benefits for wealthier ‘clients’ (at significant additional cost of course). These benefits can be anything from nicer rooms to gourmet food and access to business centers.

My first reaction to the piece was, what I expect, the desired response – indignation. In a country like the US where there are countless healthcare horror stories (the story of a carpenter having to choose which fingers to reattach as covered in Sicko is particularly famous), this seems outrageous. How can some people not afford access to healthcare at all, and yet others are paying huge sums to stay in private rooms and eat soft cheeses?

I believe in my case, this sense of indignation was particularly strong because I come from one of the many non-US developed countries in the world with a basic but functioning universal healthcare system. No one avoids going to hospital for fear of being bankrupted by the cost. No one has to make horrible decisions about which appendages to reattach. The only major drawback in most universal healthcare systems is procedures that are non-life threatening can have significant wait times.

A good example of this is getting surgery to repair an ACL. You can get it done through the public health system (Medicare in Australia), free of charge – or close to free. However, because you are not going to die from a ruptured ACL, you are likely to have to wait for 1-2 years to get that surgery done through Medicare. If, on the other hand, you have something like $5,000-$10,000 you can have it done next week[2].

As you may have observed from this example though, this sounds very close to what I was getting all indignant about in the first place – wealthy people buying access to better healthcare. In fact, in most universal healthcare systems, including Australia’s, the wealthy do have the option to pay more to receive access to better care and/or skip to the front of the queue. In reality, the NY Times article could easily have been talking about Australian hospitals. What is more, the ability of richer patients to pay for better service is often viewed as necessary for the system in Australia – the extra money paid by wealthy patients helps to fund the system for others. So why does it feel different?

After several days of mentally dissecting this issue I think I have come to a conclusion as to why the NY Times story got such a reaction out of me and yet I had a generally positive impression of the private health system in Australia. The key difference (at least in my mind) is the extent of the privatization of the healthcare system. In the US, healthcare has been privatized to such an extent that some people have been priced out of the market completely. When this is contrasted with the opposite end of the spectrum – private rooms, nicer robes, lobster stuffed with tacos – it highlights that the problem with the system is not an overall lack of resources, but that those resources are being allocated in such a way that some people do not get access.

Contrast this to the existence of private health systems in countries with universal healthcare. Even though some patients are able to access better facilities (and potentially doctors), everyone has access to a (generally) good level of healthcare, regardless of wealth or insurance policy. Because of this, the fact that some people can pay extra for nicer rooms seems much less important. The system has enough resources for everyone – so it is not perceived as resources being taken from poorer patients.

However, it is worth asking the question of whether this is right or simply a convenient piece of logic.

To assess the morality of the wealthy having the ability to purchase better healthcare services, we have to recognize the two main constraints on a healthcare system. The first constraint is the supply of personnel, equipment and medical supplies. The second constraint is the supply of money. These constraints are not unrelated. An endless supply of money will not help if there is a shortage in equipment/personnel at a given point in time. But money can help to increase the supply of these things in the future.

If we accept the premise that wealthy patients benefit healthcare systems by adding additional money into the system, going back to the constraints above, we can see that essentially this is a short term sacrifice for a longer term gain. Assuming that the demand for healthcare will always exceed supply, wealthy patients skipping to the front of the queue will take resources away from poorer patients in the present. They occupy beds, take time away from doctors and require access to equipment just like any other patient. However, they also pay money into the system that allows future patients to access treatment they might not otherwise have had access to.

Here is where it gets a bit murkier. If we are saying that payments from wealthy patients are needed for the system to function in the future, are we not then implying that the system is underfunded? Why can that money not come from other sources such as higher tax rates or lower spending in other areas of the budget? The problem with that line of thinking is that in any realistic government budget, there will always be room for additional healthcare funding. No government is ever likely to fund a healthcare system to the point that everyone gets the best possible treatment instantaneously[3]. So even in a much better funded public health system than currently exists in most countries, additional funds provided by wealthy patients will still allow for better treatment of other patients in the future.

All this does not mean we have to like the US model of healthcare where money plays far too big a role for the comfort of many. Denying patient access to healthcare (or bankrupting them for emergency care) in a modern developed country is a deplorable situation. But my overall conclusion is that it is best to focus your indignation on the real issues with the system – the excessive insurance premiums, the tying of affordable insurance to employment, the huge markups charged by many hospitals and the unnecessary expensive treatments added to patients bills.

As outrageous as it seems to picture wealthy patients receiving lavish treatment in private rooms while others are avoiding necessary treatment for fear of the cost, it is not the real issue. In fact it is probably providing a net benefit in a deeply flawed system.


[1] Those that know me will find this very unsurprising

[2] This cost, it should be noted, is still a fraction of the $55,000+ my health insurance company paid for that procedure in the US.

[3] If that was the case, you would also have idle resources for much of the year

The Darker Side of Meritocracy

Meritocracy. An ideal world where everyone is rewarded based on his or her individual qualities. The intelligent and the hardworking become the rock stars, the lazy and ignorant are doomed to a life of mediocrity. But would a true meritocracy be as idyllic as it sounds?

As was covered in Part I, there are a number of problems with defining and identifying merit. In Part II, we are going to overlook these issues and imagine what a real meritocracy might look like, and why, despite what they might say, the vast majority of people actively undermine meritocracy on a regular basis.

What Would a True Meritocracy Look Like?

Assuming we have some agreed upon way to define and identify merit, what would a true meritocracy look like? For a pure meritocracy (i.e. one in which the success of a given person is solely determined by their own actions and intelligence) to exist, each individual’s merit needs to be determined solely by his or her own individual quality.

The problem with this is, in the real world, parents have a huge influence on a child’s chances of success. This influence comes in an infinite number of forms, but includes intangible things like advice, help with homework, introductions to influential people, and being a positive role model, as well as tangible resources such as money and access to the best schools.

If parents have such a large influence on the success (or failure) of their children, how can a true meritocracy exist? Realistically, to achieve a true meritocracy, the government (or some independent body) needs to equalize parents’ influence on their child.

This equalization can take two forms. The first form is providing resources and assistance to less well off parents to try bring them up to level of parents in the upper classes. This typically includes things like welfare payments, subsidized/free health care and housing assistance, but also includes scholarships and other programs offered to help disadvantaged kids.

The second form of equalization is typically more controversial and involves reducing the ability of upper class parents to provide advantages to their children. These types of measures are far more rare, but they do exist – policies such as inheritances taxes and the removal or restriction of private schools[1] are two examples.

The reason this second type of measure is so rare is because it starts to reveal the underlying tradeoff. The tradeoff being that ensuring everyone gets the same quality upbringing means that, for some children, the quality of their upbringing has to decrease.

But even if we were willing to accept more extreme policies, they can only realistically go so far. No government can legislate to ensure every child is read to at night, and nor can they implement a ban on reading to children to make sure no child gets an advantage. No government can legislate away deadbeat Dads or Moms that get drunk in front of the kids. Which means that if you are going to create a true meritocracy, there is only really one option – take the parents out of the picture completely. This is where things start to get a little scary.

To guarantee every child receives the exact same upbringing and education, the government (or some independent body) would need to remove parents from their children’s lives. This could take various forms. A Logan’s Run style scenario where everyone is ‘terminated’ at age 30 – essentially creating a nation of orphans is one potential option. Another would be taking children at birth and raising them in industrial scale nurseries and boarding schools out of reach of parents, somewhat akin to Aldous Huxley’s Brave New World (without the presence of castes or the extreme social conditioning).

There a numerous ways that one can envisage removing a parents’ influence from their children, but the difficulty is imagining one that does not sound like a good premise for a movie about a dystopian future. In fact, the options are so unappealing that even the most repressive and extreme regimes in history have shied away from this kind of intervention.

If this is what a society would need to do to implement a true meritocracy, are there at least some upsides?

A Fairer System?

One of the key arguments made for meritocracy is that it is a ‘fairer’ system. But is it fairer (whatever that means), or are we simply replacing one lottery with another?

The current system is one in which your future success is dictated by some combination of who your parents and/or role models are (‘nurture’) and your own individual abilities (‘nature’). A true meritocracy, as we have been describing it, is simply a system in which the ‘nurture’ component has been standardized.

Is that actually fairer though? There will still be winners and losers, but now the people born with a dud genetic hand are probably worse off then in our current less meritocratic world. Unlike the current world we live in, there is no chance that a superior work ethic instilled by charmingly humble parents will get someone ahead. There are no inspiring stories of underdogs beating their better-credentialed rivals through pure determination. Rocky Balboa never even gets to fight against Apollo Creed. In a true meritocracy, the favorite always wins – that is the point of system.

A Better System?

By ensuring that the best and brightest are the ones that rise to the most influential positions, are we at least guaranteeing the fastest possible rate of progress for humanity? The answer to that question depends on how you believe progress is made.

Someone who believes that progress is only really made by rare transformative geniuses, like Einstein and Hawking, should be in favor of a more meritorious society. The risk is that a genius will be born to bad parents or in the wrong country, and as a result, that genius is wasted and substantial progress is forgone. To minimize the risk of this happening, a rational person should be willing to sacrifice certain freedoms (through more government intervention) to make sure that fewer geniuses are ‘wasted’.

On the other hand, if a person believes that progress is made by the cumulative effort of many, many intelligent (but not unique people), they should not be so worried about a true meritocracy. In this case, the loss of some geniuses to bad upbringings and poverty is much less consequential as they will be replaced by other equally or slightly less intelligent people. Maximizing the overall level of child welfare should be the priority, which, to most people, would mean allowing parents to raise their own children as far as possible.

Saying versus Doing

Stepping away from the theoretical, there is a lot that can be learned about people’s preferences in regard to meritocracy by simply looking at their actions in our world today. There is an Italian proverb that I enjoy reciting from time to time to make myself sound intelligent:

“Between saying and doing, many a pair of shoe is worn out”

Aside from the aforementioned reason, I bring this up now because people’s actions often reveal their true preferences much more accurately than their words. This is particularly true when it comes to meritocracy. In my experience, there are few people that do not actively attempt to give themselves (or those they care about) some advantage over others, and even fewer that would not take advantage of an opportunity that was presented to them.

A common example is private schools. These schools, by definition, are unmeritorious. Their business model is that parents will pay money (often large amounts of it) to send their children to a certain school exactly because they believe it will provide their child with an advantage over other children that don’t go to that school. If they did not believe it provided their children with an advantage, no rational parent would pay to send their child there.

Inheritances, giving someone a job because you know them, private tutors, moving to a better (i.e. more expensive) school district, helping out the kids with homework or even reading to them at night are just some of the endless ways that everyone, myself included, undermines a true meritocracy.

Summary

Despite the platitudes and mainstream acceptance, a true meritocracy is not what we really want as a society. Any serious thought on the subject quickly reveals a true meritocracy it is all but impossible to implement, and if implemented, the reality would be a dystopian world worthy of a George Orwell novel.

However, once the realization is made that a true meritocracy is impossible and undesirable, the remaining conclusion is that no one is truly arguing for or against meritocracy, everyone is simply arguing for a different shade of grey. The introduction and removal of various policies simply makes that shade slightly darker or lighter.

This is an important conclusion because it changes the perspective of the argument. There is no right vs. left, haves vs. have nots, good vs. evil. There is just people arguing for incremental changes. Each country, with every election, is simply working out what shade of grey they prefer.


[1] Many countries in Europe do not have private school systems, including education pinup nation Finland.

The Dark Side of Meritocracy

In recent years, discussion about economic concepts like inequality and income mobility has been everywhere. Thrust into the spotlight by the global financial crisis, they have rarely left the front pages thanks to Thomas Piketty’s Capital in the Twenty-First Century and a series of rolling financial crises in Europe. These days you can’t even enjoy your artisanal quail egg omelet and fair trade coffee without some bearded, tweed wearing, artisanal whiskey distilling, overgrown trust fund baby complaining about how unfair it all is, in between cashing rent checks from his parents.

When it comes to discussions of inequality though, one of the underlying assumptions that few are willing to challenge is that the drivers of inequality largely boil down to nepotism and inherited wealth, while the answer to most inequality based problems comes down to one idea: meritocracy.

What is a Meritocracy?

Meritocracy is a system in which the people who hold power (through democratically elected means or otherwise) are those that are most deserving based on individual merit. In common use, it is usually taken to be slightly broader than that – a world in which money and success are allocated, perfectly, to those who are deemed to deserve it the most.

In an increasingly polarized political system in the US, meritocracy – or ‘the right to rise’ – is often the only thing that politicians on both sides of the aisle seem to agree on. The ideal of meritocracy is so ingrained in the US that Americans are famous for their belief that hard work will be rewarded with untold wealth and success. But this belief is far from unique to the US. In Australia meritocracy has long been considered part of the national identity with politicians of all stripes often talking in jingoistic terms about ‘the fair go’.

For all the talk of meritocracy though, how feasible is it in the real world? What would be some of the major hurdles to implementing a more meritocratic system?

Defining Merit

The first question that should arise whenever meritocracy is discussed is how is merit defined? There are 4 basic criteria that most commonly are thought of as contributing to merit:

  1. Qualifications
  2. Work ethic
  3. Intelligence
  4. Experience

For almost all competitions where there are winners and losers – jobs, university positions or other – some combination of these traits will generally be used to decide a winner. To keep things simpler, let’s focus on the job market for now.

The first thing to consider when defining merit for a given job is that to have an accurate measure of merit, the criteria need to be modified for every position. Jobs requiring manual labor place a higher value on work ethic but little value on qualifications. Jobs in tech often place higher value on intelligence, but less on formal qualifications and, depending on the role, large amounts of experience can be seen as detrimental. Most jobs will require applicants to possess experience in one or more specific areas.

For the most part, this customization of criteria for each job is already being done – a job advertisement is essentially a statement of the criteria that merit will be assessed by. But the question is, are those criteria actually the correct ones to identify the best possible person for a given job? I believe the answer to that question is a resounding “no”. Let me explain why.

Let’s look at a common example that anyone who has tried changing sector, industry or country in his or her career will be able to relate to.

Imagine you have been working for around 10-15 years and have spent all of that time in one industry[1]. During that time you have picked up a lot of useful workplace skills, spreadsheets, experience with various applications, writing skills, general how-not-to-piss-everyone-off skills and so on. Now you want a new challenge that will require a lot of the skills you have, but in a different industry. You approach a recruiter, bright eyed and excited by the possibilities, but despite your best efforts to sell your skills as relevant, the recruiter basically discards your experience as worthless and tries to push you towards a low level role or something in your old industry.

This experience is a simple example that reveals an underlying truth – if we were being truly meritorious, there could be no fixed criteria for merit for any job because there is no way to preemptively identify what combination of skills and experience will ultimately prove to be the most valuable.

The possibilities for what combination of skills and experience lead to the best performance in a role are endless. Many successful business owners do not have MBAs. Many of the best investors on Wall Street do not come from finance backgrounds. Some of the best NFL punters are ex-Australian Rules Football players. What people who excel tend to have in common is a combination of skills and experiences that allows them to bring a different perspective to a problem.

Yet, despite history proving time[2] and time again[3] that different perspectives are often vital to important insights, it is a rare employer or recruiter that will take a bet on a candidate with ‘unusual experience’ rather than a candidate who ticks all the boxes. The reason for that is simple – it is safer. Choosing the candidate that ticks the boxes provides cover (“I gave you what you asked for”) and it gives a better guarantee of an acceptable level of performance. The unusual candidate could be fantastic – but they could also be a complete flop who turns out to be way out of their depth.

Unfortunately, this is only the first hurdle for a true meritocracy – if merit is a difficult thing to define, it is an even more difficult thing to measure.

Measuring Merit

Once we get past the step of deciding what criteria will determine the most deserving applicant, the next step is deciding who best meets those criteria. A quick look at the application process for college admission or a technical job will give you an instant appreciation for the lengths that people will go to try and get an accurate assessment of an applicant’s true merit.

Tests, interviews and essays are probably the most common tools used to assess merit but all can be (and are) gamed by people who understand the system. Material for tests can be rote learned with little to no understanding necessary. Interviews are notorious for being poor predictors of talent, which makes sense when you consider that the most confident people are often delusional. Essays, aside from providing evidence of basic writing skills, are assessed subjectively.

Even if these tools for assessing merit were designed in such a way as to prevent gaming the system, these are still three very narrow tests of ability. As Megan McArdle explains, the experience in China shows that selecting for people who do well on exams gives you… a selection of people who do well on exams.

Assumptions and Prejudice

One interesting side effect of the difficulty in determining merit is it leads to people basing their assessment on completely superficial qualities (at least partially). A good dress sense, physical attractiveness, and being an eloquent speaker are just some examples of relatively superficial qualities people use to assess intelligence and merit. As frustrating as this can be for the unshapely, poorly dressed, mumblers out there, these are all things that can be improved and worked on (at least to some degree). Others are subject to prejudices that cannot be addressed – the impact of race on the ability to get interviews, for example, is well established.

Another concerning trend is the increasing use of someone’s current level of success/wealth as an indicator of merit. That is, if someone is wealthy and/or successful, they must be someone who is highly intelligent and works harder than everyone else. This line of thinking is dangerous for two reasons:

  1. Too much value is placed on the opinions of wealthy and successful people – particular on topics outside their domain. Anyone who has listened to Clive Palmer or Donald Trump speak should know that is a mistake.
  2. The implicit assumption made when you believe wealthy and successful people are fully deserving of their place in the world is that anyone who is poor and unsuccessful is also fully deserving of their situation.

Evidence of this thinking is present everywhere to some degree, but seems particularly prevalent in the US[4], where TV shows like Shark Tank are extremely popular and prominent CEOs are regularly asked for their opinions on public policy issues.

This belief system can largely be explained as the flip side of the optimistic view American’s have of their economic prospects. As this paper from the Brookings Institution highlights, American’s are far more likely to believe hard work and intelligence will be rewarded and yet are second only to the UK in terms of how closely correlated a son’s earnings are to his fathers (i.e. hard work has the least chance of improving your situation). If you truly believe that hard work and intelligence is all you need to be successful, you must also believe that people who are currently experiencing success have those attributes.

Best Person for the Job

Going back to our problems with creating a meritocracy, everything discussed so far has overlooked a key factor in this endless quest to find the most deserving – people are not cogs that can be simply transferred in and out of a machine seamlessly. The person who ‘deserves’ the job on merit (provided we can define it and measure it accurately) is often NOT the best person for the job. The best person for the job is often determined by qualities such as:

  • how that person fits in with the team culture,
  • their personality type, and
  • how they respond to authority (or the lack thereof).

These traits are all key factors in how well someone will perform in a given role and yet none would typically be thought of as meritorious qualities.

This realization is not new. Employers and hiring firms have been pushing the idea of the ‘beer test’ (asking yourself which of the candidates would you most like to go for an after-work beer with) for some time now. But it does beg the question – what would happen if a company simply hired the ‘best’ candidates for each position without considering whether these people will work well together? Would that team be more productive than a team that hired less ‘deserving’ candidates but aimed to build a harmonious work place? The entire body of management knowledge (and every buddy cop movie ever made) would tell us otherwise.

Summary

One thing that becomes obvious when you start thinking about how a true meritocracy would actually work is how difficult it would be to implement:

  • Many of the criteria we associate with someone being deserving of a role or position are subjective or exclude applicants who would in fact be far superior.
  • Our methods of assessment are often deeply flawed, subject to gaming and our own prejudices.
  • Selecting the most objectively deserving candidates is not guaranteed to provide the best results anyway.

Yet, despite the reasons above hopefully being enough to give pause the next time someone begins expressing frustration with the current lack of meritocracy, all of these issues are only really logistical problems.

There is a good argument to be made that we can and should try to improve on all of these things – that we should aim to get better at identifying the right people and refine our methods of assessing skills. We should pay more attention to team fit and personalities when selecting the best candidate. It is hard to imagine the world being a worse place if employers were more open minded about what skills might be valuable to their company and sociopaths were less likely to impress during an interview.

However, the next question is how far should we take this. What does a truly meritocratic society look like and is it something we really want? That is the subject of discussion in Part II in this series on meritocracy.


[1] You can easily replace ‘industry’ in this story with ‘company’, ‘field’ or ‘country’.

[2] Einstein famously worked at a patent office where his work often exposed him to the transmission of electric signals and electrical-mechanical synchronization of time. Exposure to these topics helped him to arrive at his conclusions about the nature of light and the connection between space and time.

[3] Steve Jobs often talked about the importance of a calligraphy class he took in shaping what fonts were best used in operating systems.

[4] Australia’s proclivity to tall poppy syndrome does have some positive side effects

Does Wealth Inequality Impact Growth?

I recently read a paper entitled Does wealth inequality matter for growth? The effect of billionaire wealth, income distribution, and poverty[1] that has been getting some coverage in economic circles. One of the reasons for the coverage is that income and wealth inequality has become a major discussion point in economics, since the release of Thomas Piketty’s Capital in the Twenty-First Century.

The other reason for the attention is that the paper, although implicitly agreeing with Thomas Piketty’s conclusion that inequality is detrimental to economic growth, puts a twist on the conclusion. This paper, through a series of statistical models, provides evidence to suggest wealth inequality in itself does not impact economic growth, but that wealth inequality that arises due to government corruption impacts on economic growth.

Reading between the lines, this conclusion essentially reverses the prescription Piketty has been arguing for (greater intervention from government to redistribute wealth) and instead implies the opposite, that government should be reduced and basically get out of the way.

At a high level, there are two reasons I wanted to review this paper. These reasons are:

  1. To highlight the importance of skepticism when reading headlines based on scientific literature, and
  2. To provide an example of how a lack of domain knowledge[2] can cause problems in the world of statistics.

The Setup

The basic experiment setup is as follows. The authors (Sutirtha Bagchi and Jan Svejnar) took the Forbes List of World Billionaires for four years, 1987, 1992, 1996[3] and 2002. They then split the billionaires in these lists into two groups: those that have seemingly gained their wealth through political connections, and those that apparently gained their wealth independent of political connections.

Once grouped, the researchers aggregated the wealth of the billionaires by country to calculate politically connected billionaire wealth, politically unconnected wealth, and (adding these two pools together) total billionaire wealth – for each country in the dataset.

To normalize this measure of billionaire wealth across countries, they then divided the billionaire wealth for each country in each year by the total GDP for that country in that year. This provided a measure of billionaire wealth (politically connected, politically unconnected and total) as a percentage of GDP[4], which was taken to be a measure of inequality.

In addition to the three variables for each country – politically connected wealth inequality, politically unconnected wealth inequality, and total wealth inequality the authors also added a number of other variables, including measures of poverty, income inequality, income level (as measured by real GDP per capita), levels of schooling and the price level of investment[5].

Using linear regression, these variables were then used to predict GDP growth per capita for the following five years (after the year the variables corresponds to). For example, the variables for the year 1987 were used to predict the GDP growth per capita for the years 1988 to 1992.

Without getting too deep into how linear regression works, this approach was informative because it allowed for an assessment of the impact of each variable on growth, assuming all the other variables were held constant. With a variety of models constructed, the authors were able to assess what impact politically connected inequality had on growth, assuming politically unconnected inequality, income, poverty levels, schooling levels and the price level of investment were held constant.

The other big benefit of using linear regression is that it provides information about which of the variables used in a model are actually useful (“found to be significant”) in making a prediction. Essentially, variables that are found to not be significant can be excluded from the model with little or no decrease in the accuracy of the model.

Before moving on to the results, please be aware, for the sake of brevity, I am greatly simplifying the experimental setup, and completely ignoring a range of robustness and other testing the authors did. For those details, you will need to read the full paper.

The Results

At a high level, the results of the models constructed suggested the following in relation to the impact of inequality on growth:

  1. Politically connected wealth inequality (regardless of how it is normalized) was found to be a statistically significant predictor of growth. In all cases the coefficient was negative, indicating the higher the level of wealth, the lower the predicted growth.
  2. Politically unconnected wealth inequality (regardless of how it is normalized) was not found to be a significant predictor of growth.
  3. Wealth inequality (when political connectedness is ignored) can be a significant predictor of growth depending on how it is normalized[6]. When found to be significant, higher levels of billionaire wealth led to lower levels of predicted growth.
  4. Income inequality was found to be a significant predictor of growth in only one of the 12 models constructed. In the case where it was found to be significant, greater income inequality led to predictions of higher growth.

In addition, the model also provided some other interesting conclusions:

  1. The level of income in a country was found to be a significant predictor of growth in all cases. The models suggested that the higher the level of income in a country, the lower the predicted growth[7].
  2. The level of poverty was not found to be a significant predictor of growth in any of the models constructed.
  3. The level of schooling (for males or females) was not found to be a significant predictor of growth in any of the models constructed.

Caveats and Problems

Already from some of the findings above, you probably have some questions about the results. Poverty and schooling and income inequality have no impact on economic growth? The conclusions can change based on how billionaire wealth is normalized? You are right to be skeptical, but lets break down why.

Determining Wealth is Difficult

The first problem, and it is one explicitly acknowledged by the authors, is that measuring wealth (and therefore wealth inequality) is very difficult. Most of the difficulty arises from determining the wealth of the rich. In some cases, it is relatively straightforward to determine wealth – for example if the billionaire’s wealth is tied up in one company (e.g. Bill Gates and Mark Zuckerberg). But in other cases, particularly with inherited wealth, the assets are diversified, held in a large number of holdings, trusts and companies across the world. In some further cases, it is extremely difficult to value the assets of a billionaire due to the unique nature of the assets (this is why Donald Trump’s worth is always the subject of debate).

To get around this, problem, the authors have relied on the Forbes list of billionaires. In terms of billionaire wealth, this is probably the best researched list of billionaires available, but by Forbes own admission “It’s less about the [net worth] number, per se… this is a scorecard of who the most important people are.”

Is Billionaire Wealth a Good Predictor of Wealth Inequality?

The authors built their measure of wealth inequality using the wealth of billionaires. But does this make sense even if we assume the Forbes list is accurate? There are two main problems I see with this approach.

The first is that ‘billionaire’ is an arbitrary cutoff point. Extremely wealthy people with wealth over the billion-dollar cut off one year regularly fall out of the three comma club the following year. For smaller countries with very few billionaires, this can have an outsized impact on their measure of wealth inequality from year to year.

The second issue is that looking at billionaire wealth tells you nothing about the distribution of wealth below the $1 billion mark. An example is provided in Chart 1 below.

Chart 1 – Wealth Distribution Across Two Hypothetical Countries

What Chart 1 shows is two hypothetical countries with 10 people each and the same amount of total wealth. Country 1 has two people who are extremely wealthy (but not billionaires), while the rest are far less wealthy. In Country 2, we have one billionaire but a much more even distribution of wealth amongst the rest of the population. Looking at the chart we would conclude that Country 1 has a higher level of inequality, but if we calculate inequality based on methodology used in the paper, Country 2 will be determined to be more unequal than Country 1. In fact, Country 1 would be assigned an inequality value of 0.

Obviously this is an exaggerated example, but it illustrates the point that there is a lot that could be happening below the $1 billion mark that is completely ignored by the measure used. I would also argue that the distribution of wealth amongst the population who are not billionaires is going to be much more important for growth than the ratio of billionaires to everyone else.

What is Politically Connected?

This is the part of the experiment setup that will probably end up being the most contentious, and relates back to the lack of domain knowledge. The problem is the authors could not possibly know of every billionaire on the list, the circumstances of how they accrued their wealth, and make a judgment call on whether political connections were a necessary precondition. As a result, they had to rely on various news sources to draw their conclusions and this led to some interesting outcomes.

For those that read the Wonkblog piece I linked to earlier, you may have noticed a chart in which Australia was adjudged to have 65% of billionaire wealth over the four years looked at being politically connected, putting it the same range as India and Indonesia. To most Australians this would be a hugely surprising result given Australia’s strong democratic tradition, strong separation of powers and prominence of tall poppy syndrome[8].

Generously, the authors of the paper provided me with the classifications that led to this number and it boils down to the fact that they have classified Kerry Packer as a politically connected billionaire. For those that know of Packer (pretty much every Australian) it would seem ridiculous to class him in the same bracket as Russian oligarchs or Indonesian billionaires who benefitted from the corrupt Suharto regime. But for someone who is not from Australia, they had to make this judgment based on newspaper clippings talking about Packer’s lobbying efforts.

In the case of Australia, having a high percentage of politically connected billionaire wealth has little impact. Once politically connected billionaire wealth (i.e. Kerry Packer’s wealth) is taken as a ratio of GDP, the number becomes very small because Packer’s wealth is dwarfed by the relatively large Australian economy. But what about other countries? How have various judgment calls impacted their inequality measures and therefore the model?

As I mentioned at the start of this section, it is unreasonable to expect the authors to be able to know how every billionaire worldwide accrued their wealth and the role of the government in that process. Additionally, the fact that there may be issues with some classifications does not mean we should throw away the results. However, it does mean any conclusions we draw from the results should be caveated with this problem in mind.

Unknown Unknowns

The final problem comes down to the high level question of what drives economic growth.

When you consider all the different things that can impact on the economic growth of a country over the course of five years, you quickly realize there are an almost unlimited number of factors. Commodity prices, what is happening in the economies of major trading partners, weather patterns, population growth, war, immigration, fiscal policy, monetary policy, the level of corruption and the regulatory environment are just some of the factors that can have a major impact on growth.

When economists build models to predict growth, they make choices about what factors they believe are the major drivers of growth. In this case, the authors have used factors like income levels, schooling and poverty levels. But what about some of the other factors mentioned above? Could these factors have better explained growth than politically connected wealth inequality?

This choice of variables is further complicated by the interrelatedness of the factors impacting growth. Is population growth driving economic growth, or is it because population growth indicates higher levels of immigration? Is government corruption holding back growth, or is it that corruption is siphoning off money from schooling and other public services?

When it comes to the models in the paper, the key question is if politically connected billionaire wealth is really impacting growth, or if it is simply acting as a proxy for some other measure (or measures). For example, are high levels of politically connected billionaire wealth dragging on growth, or is this measure acting as a proxy for the level of corruption in an economy and/or the prevalence of inefficient government created monopolies – which are the real drags on growth? Unfortunately, there is no definitive way to know the answer to these questions.

Conclusions

As mentioned at the outset, inequality and its impact on growth and the economy in general has been a popular topic of discussion in economic circles for the last 1-2 years. In many ways, it is the defining economic discussion of our time and has the potential to shape economic policy for a generation.

In an effort to provide more information in that debate, the authors of this particular paper deserve plenty of credit for taking an innovative approach to a difficult problem. However, at least in my mind, the results raise more questions then they answer.

That, it should be noted, is not a criticism, but is often the outcome of research and experiments. Results can often be confusing or misleading, and can only later be explained properly through further research. This is all part of the scientific method. Hypotheses are created, challenged, and either proved incorrect or strengthened. They are always subject to be proven wrong.

Unfortunately this nuanced process is not one that lends itself to catchy headlines and this is where we find one of the key problems with reporting of scientific results. Most authors, including the authors of this paper, are fully aware of the limitations of their findings. That is why you will find the conclusions section filled with words like ‘suggests’, ‘possibly’ and ‘could’. But those words do not make for good stories and so the qualifiers tend to get left out.

It is for this reason, if you are interested in the results of a particular paper or study, it always worth looking at the detail. With that, I’ll leave the final word to Sutirtha and Jan (emphasis mine):

“These and other examples, together with our econometric results, suggest that the policy debate about sources of economic growth ought to focus on the distribution of wealth rather than on the distribution of income. Moreover, particular attention ought to be paid to politically connected concentration of wealth as a possible cause of slower economic growth. Further research in this area is obviously needed, especially with respect to the effects of wealth inequality at different parts of the wealth distribution, the possibly declining effect of unequal distribution of income on growth, and the role of poverty.”


[1] S. Bagchi, J. Svejnar, Does wealth inequality matter for growth? The effect of billionaire wealth, income distribution, and poverty, Journal of Comparative Economics(2015), http://dx.doi.org/10.1016/j.jce.2015.04.002

[2] Domain knowledge is knowledge of the field that the data relates to.

[3] A change in the methodology used by Forbes to compile the list between 1997 and 2000 led them to instead choose 1996.

[4] The authors also try normalizing by other factors, such as population and physical capital stock, but this doesn’t substantially change the results of the model.

[5] A measure of how expensive it is to invest in capital within a country.

[6] When normalized by population, billionaire wealth is found to be a better predictor of growth than politically connected wealth.

[7] This may seem strange, but actually nicely captures a phenomenon in economics where lower income countries experience higher growth as they ‘catch-up’ to higher income countries.

[8] A perceived tendency to discredit or disparage those who have achieved notable wealth or prominence in public life.

Women in the Workplace – Where is Everyone?

Cross posted from OpenDataKosovo.org:

Continuing our series on Gender Inequality and Corruption in Kosovo, in Part IV we are going to build on Part III and use our understanding of the participation rate to compare the participation rate in Kosovo across a range of countries, as well as look at the reasons for non-participation (“inactivity”). If you don’t understand what a participation rate is (SPOILER: it is not the same as the unemployment rate), or just want to make sure you get the full picture, please go back and read Part III.

Click on the chart below to interact with the data!

sunburst_pic

Sunburst chart created by Festina Ismali

Comparing Participation Rates

Comparing participation rates across countries provides insight into broad demographic trends and the specific employment situation in a country relative to other countries. For most high income nations, the participation rate tends to be around 60%. That is, 6 out of every 10 people of working age are actively engaged in the employment market (whether they currently have a job or not). While that may sound low, this accounts for parents who stay home to raise children, students, retirees and discouraged workers[1].

Once we leave high income countries, there is a much larger range of participation rates. Many very poor low income nations in Asia and Africa have extremely high participation rates of well over 80%. This is driven by pure necessity as, in many cases, there is simply no option for one partner to stay home, retire, or even for young people to continue studying.

Conversely, we also see many countries with very low participation rates of just over 40%. In some cases, these countries are involved in ongoing conflicts or are post-conflict countries (Syria, Iraq and Afghanistan all had participation rates below 50% in 2013). But in other cases, the cause is harder to identify.

Unfortunately, Kosovo is one of these harder to understand cases. In 2013, Kosovo had the second lowest participation rate of any country in the World Bank database, at 40.5%. In 2014 that number picked up slightly to 41.6%, but that was still low enough to keep Kosovo in the bottom 10, based on 2013 figures. Notably, Kosovo’s low participation rate has actually decreased substantially over the past decade (see Chart 1). In 2002, the participation rate stood at 52.8%. If that participation rate applied today, there would be an extra 134,600 people in the labour force – an increase of 26.9%.

Chart 1 – Participation Rate in Kosovo 2002 to 2014

Looking at Chart 1, another data point that immediately stands out is the low participation rate for women. In fact, with a participation rate for women of 21.1% in 2013, Kosovo has one of the lowest participation rates for women in the world. In terms of the rankings, Kosovo places between Saudi Arabia (20.2%) and Lebanon (23.3%). Looking around the region, Kosovo is also a significantly outlier (see Chart 2).

Chart 2 – Female Participation Rate for Selected Countries 2002 to 2013

Methodology Matters

Previously, in Part III, we mentioned that there were some more detailed criteria for determining whether a person is considered ‘employed’ in Kosovo. Specifically, there is one particular criteria that may partially explain Kosovo’s notably lower participation compared to its neighbors (and everyone else).

In the 2014 Kosovo Labour Force Survey, a specific methodological difference with Albania is highlighted. In Kosovo, people who work on a family run farm are not considered employed if the produce of the farm is not considered an “important source of consumption” (let’s call these people ‘family farm workers’). In contrast, these same people in Albania are classified as employed. From the 2014 Kosovo Labour Force Survey Results paper (emphasis mine):

“It is important to note that when respondents answer code 5B[2], that they do some agricultural activity but it is not an important contribution, this is not counted as employed. In 2014 69% of this group were categorized as inactive and 31% as unemployed. An important contribution is a subjective term and could depend on overall household income.”

The key takeaway here is that there is a significant population of family farm workers that are currently being classified as inactive, when in fact they are working. This at least partially explains the low participation rate in Kosovo.

Unfortunately, the paper does not provide enough information to be able to determine how many people are  family farm workers. As such, we are unable to quantify exactly how much impact adding family farm workers back into the labour force would have on the headline participation rate.

Even if we could though, this would not be fully correct either (welcome to the surprisingly complex world of labour market statistics). Many family farm workers probably do not consider themselves employed – working 1 hour a week[3] on a family farm is a pretty low bar after all. The fact that 31% of them qualified as unemployed, meaning they actively sought other work, reveals that this is not homogenous group of full time farm workers being incorrectly classified.

Worrying Trends

Methodological anomalies aside, there is also a concerning trend in the data – the participation rate for women in Kosovo has been declining for much of the past decade[4]. Despite the improving economy and significant international development assistance, the participation rate for women fell from over 34.5% in 2002 to 21.4% in 2014. There is some good news – the fall appears to have bottomed out, with 2013 and 2014 both recording higher participation rates for women than the low point in 2012 (17.8%!).

This slight uptick in recent years could be the impact of numerous initiatives to get women into the workforce in Kosovo. These range from the prioritization of grants for projects that provide jobs for women, to supporting women in registering property in their own names to help provide collateral for loans. There has also been a push by Kosovo’s first and current female President to boost participation among women. Several more years of data will be required to determine whether this is the beginning of a more substantial trend or simply noise in the data.

In the meantime, let’s get a better understanding of the current labour market by looking at a break down (see Table 1), provided in the 2014 Kosovo Labour Force Survey, of the inactive population sorted by reason for not participating.

Table 1 – Inactive Persons by Category

(A) Men (B) Women (C) = (B) minus (A)
1,000s 1,000s  (C1) 1,000s (C2) % of total
Looking after children or incapacitated adults 0.1 14.3 14.2 5.8%
Own illness or disability 13.3 8.6 -4.7 -1.9%
Other personal or family responsibilities 13.5 233.4 219.9 90.2%
In education or training 104.7 97.3 -7.4 -3.0%
Retired 6.9 5 -1.9 -0.8%
Believes that no work is available 49.5 78.9 29.4 12.1%
Waiting to go back to work (laid-off people) 0.8 0.5 -0.3 -0.1%
Other reasons 20.7 16.2 -4.5 -1.8%
No reason given 1.9 3.4 1.5 0.6%
Total  229.2 473.0 243.8 100.0%

Looking at the breakdown, there is one category in particular in which there was a large discrepancy between the sexes – ‘Other personal or family responsibilities’. In this category, 233,400 were women, amounting to 38.8% of the total population of working age women. By contrast, only 13,500 were men, amounting to 2.2% of the total population of working age men. The table also shows the calculated difference between the number of inactive women and men (see column C1). Looking at these calculated differences, we see that for the total calculated difference across all categories (243,800 – see ‘Total’ row in column C1), 219,900, or over 90%, arose from this category. This breakdown is also shown in Chart 3 below.

Chart 3 – Inactive People by Category of Inactivity – 2014

Going back to the family farm workers discussed earlier, we expect that those classified as inactive would be included in the ‘Other personal or family responsibilities’ category. However, if a significant number of women in this category were family farm workers and this was a full time role, we would also expect to see large numbers of men in the same category. The fact that we do not suggests that many men who are family farm workers also have other more formal jobs and lends support to the decision to exclude family farm workers from the employed population.

The other category where we see a meaningful gap between the sexes is the ‘Believes that no work is available’ category. As mentioned earlier, these are the people that are considered discouraged workers (i.e. those that would take a job, but are no longer actively looking). Why would significantly more women be discouraged than men? Typically, discouraged workers are the end product of long and unsuccessful searches for employment. At times of high unemployment, it will often be the case that the number of discouraged workers will also increase. Seeing that women are more likely to be discouraged than men suggests they are having a more difficult time finding employment.

To confirm this hypothesis, we need to look at unemployment rates. This will be the focus of the next piece in this series – Part V.


[1] People who would like a job but who haven’t actively sought work in the past 4 weeks

[2] Code 5b text: “Worked (at least one hour) on a farm owned or rented by you or a member of your household (even unpaid) whether in cultivating crops or in other farm maintenance tasks, or you have cared for livestock belonging to you or a member of your household (if the whole production is only for own consumption and this production does not constitute an important contribution to the total consumption of the household.

[3] Employed are considered all the persons who have worked even for one hour with a respective salary or profit during the reference week.

[4] There is no mention of when the current methodology was implemented, but it is possible that the large drop in participation rate between 2009 and 2012 was due to a change.

Women in the Workplace – Understanding the Data

Cross Posted from OpenDataKosovo.org:

Continuing our series on Gender Inequality and Corruption in Kosovo (see Part I and Part II), in Part III and the next few parts, we are going to take a detailed look at the problems women face in the labour market in Kosovo.

To do this, we will be using information from several sources, including data on participation rates, by gender, from the Gender Statistics database at the World Bank, and a range of labour market statistics from various Kosovo Labour Force Surveys, released by the Kosovo Agency of Statistics.

High Level Concepts

Before diving into the statistics, let’s first visualize and explain some of the high level concepts in labour market statistics.

Chart 1 – Population Breakdown 2014

WAC_3_1

At the highest level, the section of the population that is relevant when looking at labour market statistics is people who are of working age and are able to work. In Kosovo, this population includes all people aged 15 to 64 and is known as the ‘working age population’.

Labour Force and Inactive Populations

At the next level, the working age population can be broken down into two main subgroups – those that are considered in the labour force (i.e. ‘participating’) and those that are ‘inactive’. It is important to note that someone who is ‘inactive’ is not the same as someone who is ‘unemployed’. In Kosovo, to be considered ‘actively looking for work’ (and therefore be classified in the labour force) the following criteria must be met. The person must be:

  • currently available for work, that is, available for paid employment or self- employment within two weeks; and
  • seeking work, that is, have taken specific steps in the previous four weeks to seek paid employment or self-employment.

If either of the above criteria is not met, the person is classified as inactive.

Calculating the Participation Rate

Once the population is classified as either in the labour force or inactive, it is possible to calculate the participation rate, one of the key labour market statistics. The participation rate measures the labour force population (people employed and/or actively looking for work) as a percentage of the working age population.

WAC_E_3_1

In Kosovo, the participation rates in 2014 were as follows:

  • Male Participation Rate (2014): 61.8%
  • Female Participation Rate (2014): 21.4%
  • Overall Participation Rate (2014): 41.6%

Unlike the unemployment rate, described below, the participation rate tends to provide more stable and reliable data than the unemployment rate, as it is not affected by short-term fluctuations and the business cycle.

Employed vs. Unemployed

Analyzing the population further, the ‘labour force’ can be subdivided into two populations – those that are employed and those that are unemployed. In most cases it is obvious whether someone is employed or not, but in some situations it may not be so clear (e.g. when a person is working for the family business in an unpaid capacity). To handle these scenarios, the agency tasked with compiling the labour market statistics in each country typically has a specific definition (or definitions) of what qualifies as employment. In Kosovo, to be classified as ‘employed’ a person must meet the following high-level criteria:

“People who during the reference week performed some work for wage or salary, or profit or family gain, in cash or in kind or were temporarily absent from their jobs.”

In addition, the Kosovo Agency of Statistics includes some more detailed criteria in their methodology that clarifies when work done on family owned farms classifies as employment. This will become important later.

Calculating the Unemployment Rate

Having separated the employed from the unemployed, it is now possible to calculate the unemployment rate. To do this, we divide the number of unemployed people by the total number of people in the labour force.

WAC_E_3_2

In Kosovo, the unemployment rates in 2014 were as follows:

  • Male Unemployment Rate (2014): 33.1%
  • Female Unemployment Rate (2014): 41.6%
  • Overall Unemployment Rate (2014): 35.3%

The unemployment rate is useful as a more immediate indicator of conditions in the economy. The obvious information is provides is an indicator of how many people without a job are currently looking for employment. But, in addition, it also provides information about how much spare capacity an economy has, the risk that inflation may pick up, whether structural issues are keeping people out of work and so on.

Chart 1 – Participation and Unemployment Rates by Gender 2014

What is Next?

In the next article, we will take a look at how the participation rate (for both males and females) in Kosovo compares across the region and internationally. In the meantime, please feel free to play around with the interactive visualization below, which shows the entire working age population of Kosovo broken down into its various subgroups.

Click on the chart below to interact with the data!

sunburst_pic

Sunburst chart created by Festina Ismali


4 Reasons Fiat Money is a Great Idea and One Catch

In the world of economics and finance there are many complex topics that are poorly understood in the wider community. Differential calculus, options trading and multiple regression to take three examples. However, money and the monetary system is another topic I would quickly add to this list. The difference when it comes to money, however, is the number of people who believe they do understand the system. This leads to a range of misunderstandings including:

  1. Money in modern economies is still exchangeable for gold
  2. Printing of money will always lead to high levels of inflation
  3. Balancing a household budget is a suitable analogy for balancing the budget of a Government
  4. Paper money is worthless and doomed to fail

There is a lot of myths to dispel in that list. In this article we are going to tackle the question of why money works, even when not tied to a physical commodity (known as “fiat money”[1]). To do this, let’s start by imagining a world where there is no money. Instead of paying for things for money, everyone now has to barter for goods. What issues would people have in this system?

1. Coincidence of Wants

In a world where everyone has to barter to exchange goods, the first problem you are likely to encounter is described as the coincidence of wants. Imagine you are a pig farmer and, sick of eating pork for every meal (hard to imagine I know), you decide you would like to trade a pig for some wheat. The first hurdle is finding a wheat farmer who actually wants a pig. This is the coincidence – that you have pigs and want wheat, and that someone else has wheat and wants pigs and that both these wants occur at the same time.

Even in a simple agrarian village with only a limited number of food related products, you can already see the difficulties that will arise. Wheat is only available at certain times of the year and that will not coincide with the production of many other products. Some people may simply not like certain products, making it difficult for people producing those products to do any trading with them.

Introducing money into this scenario cleanly solves this problem by providing something to trade for what everybody wants at any given time.

2. Divisibility of Money

The second major problem in a barter system is the indivisibility of goods. Let’s go back to the pig farmer example and imagine again you want to trade pig for wheat. Assuming we find someone who wants to trade with us, how much of each do we actually trade? A pig is probably worth quite a large quantity of wheat, so what do I do if I only want a little bit of wheat? I’d have to kill my pig, give some of it to the wheat farmer, then hope I could find someone to buy the other parts of my pig. What about people producing even larger goods that can’t be sold in parts at all, such as a horse trainer or a house builder? They would constantly be forced to trade their goods for huge quantities of other goods.

Money solves this problem because it has the property of divisibility. I can sell a pig for $100, then split that money up to buy as many different types of goods as I want.

3. A Store of Value

The third problem in our moneyless world is that many of the goods we trade have limited lifespans. As a wheat farmer, if I have a good year and have extra wheat, what can I do with my extra wheat? I need to trade it for something or it will go off and be wasted.

In the past, this was such a problem, nearly every culture developed ways to preserve seasonal produce. Think about how many cultures have cured meats (prosciutto, jerky, spec), preserved fish (bacalao, pickled herring), pickled vegetables (cucumbers, onions, beans, peppers, achar) and fruit preserves and jams. Many of the most popular foods today were developed largely as a way to store produce over extended time periods in the days before freezers and refrigeration.

Although money doesn’t stop food spoiling, it does allow a farmer to sell off their seasonal produce for something that does not need to be preserved. That money can then be spent as needed in the future to purchase other goods. In the simple world of our example, that may simply mean buying preserved goods during the winter to survive until the next season. In a more complicated world it helps us do many things including to save for more expensive purchases such as a TV, a car, a house or our retirement.

4. Practicality

Continuing to build on the farming example, let’s imagine that the people of this particular farming village are trying to decide on a given (non-money) product that will become the unit of trade for everyone. Keeping in mind the points above, what would be the best options?

It would need to be something that could be easily divisible, which rules out livestock and any large objects such as furniture, tractors, houses and so on. It has to be something that doesn’t go off or require preservation, which rules out vegetables, fruits, grains and so on. What if they decided to use something that met these basic conditions like salt or honey?

Here we run into another issue that is neatly solved by money – practicality. Even trading in a commodity such as salt or honey would face a number of hurdles:

  1. Every transaction would need to be weighed or measured out to ensure the quantity exchanged is correct
  2. People would have to carry around honey or salt to complete transactions, and for large transactions, that could be a significant burden
  3. There would need to be some measure of the quality of the commodity being traded. How pure is the honey or salt? Do salts from certain places carry more value? Has the honey been diluted?
  4. People would have to find ways to store large amounts of these commodities in a such a way that they are safe and don’t get stolen, eaten or washed away

Problems 3 and 4 could be alleviated by some third party fulfilling the role of a salt or honey bank. This bank could verify the quality of the commodity and store large quantities of these commodities on behalf of their customers (for a small fee of course). It could even provide facilities allowing customers to access their deposits. This could be done by allowing access to the commodity itself, or by issuing some sort of official document or paper that the holder could bring to the bank to exchange for the commodity (it’s starting to sound pretty close to money at this point right?). But even in this case, the commodity would still need to be stored somewhere physically.

All these concerns are things we don’t have to worry about in a world with money. Notes and coins are extremely portable, meaning people can carry even very large amounts in small leather foldy things (let’s call them “wallets”). They come in predefined amounts which mean they don’t have to be measured out and quantities can be quickly verified. Finally, in a fiat money system, the vast majority of money doesn’t need to be physically stored, it is stored as numbers in a bank account.

The Catch

The catch in a fiat monetary system is that it is essentially a system built on mutual trust. For me to accept money as payment for goods I am selling or services I am providing, I must believe that I will be able to trade that money for goods and services, of approximately the same value, in the future. The person I purchase those goods or services from, in turn, must also believe the same thing, and so on down the line. If, at any given point, people in general stopped believing money would be able to be traded for goods or services in the future, the fiat money system would collapse very quickly.

We can see some examples of this in the real world in countries where hyperinflation and/or currency controls have occurred. In most cases, the local currency often becomes close to worthless as people substitute to either a more stable currency (typically the US dollar) or hard commodities. Luckily, these occurrences have usually been limited to small and poorly run economies and have not seriously impacted the legitimacy of the fiat money system overall.

What would happen if the population of a major developed economy stopped believing their currency would be accepted in the future? At that stage all bets are off. There is a substantial community of people that does have this concern, and are preparing for this scenario by buying hard commodities such as precious metals. But realistically, they should also be buying guns, canned food and digging a shelter in the backyard, because a failure of the monetary system would be a complete catastrophe.

Overall

Looking at the above points, we can see there are a large number of advantages to fiat money. Many of the transactions we undertake every day would become extremely burdensome in the absence of money. A lot of larger business transactions would be impossible in a barter system. Although money introduces some its own complications, it is hard to argue that the world would be anywhere near as complex or advanced if we had persisted with a barter system or a commodity based trade system.

Money in Three Charts

To finish off, let’s take a look at some stats on the values and volume of currency on issue for the worlds reserve currency, the US dollar. All the underlying data and more is available at the Federal Reserve website for those interested. I’m trying out some new interactive charts so please click, play and let me know what you think!

Chart 1 – Value of US Currency in Circulation by Denomination

Chart 2 – Volume of US Currency in Circulation by Denomination

Chart 3 – Comparison of Different Measures of Money Supply

For those that are unfamiliar, there are different ways of measuring the total money supply. The following chart compares 3 different measures – M1 money supply, M2 money supply and cash. This data is from the Federal Reserve of St. Louis website.

[1] Fiat money is money that derives it value only from Government rule or regulation. This is as opposed to commodity or representative money which is tied to the value of an underlying commodity.

Greece Crisis – Update

Update #2 – July 14, 2015

  • After the comprehensive win for the ‘NO’ campaign in the Greek referendum, negotiations reopened between the Greek government and the institutions. One notable difference this time around was the distancing of the IMF from the process, as Greece has technically already defaulted on their IMF debt.
  • Despite a ‘NO’ vote being sold in Greece as strengthening their hand in negotiations, the people negotiating on behalf of the institutions were not buying this line. What quickly became clear was that even if Greece completely capitulated and accepted the terms of the reform package offered pre-referendum, that would no longer be enough for a deal. The most commonly cited reason for the hardened stance was that the institutions no longer trusted the Greek government to undertake the reforms it was signing up to.
  • During the week, it began to look increasingly likely that no deal would be made. At one point, every country in the shared currency zone except France and Cyprus was pushing for a Greek exit ahead of the final discussion to take place on Sunday night.
  • After marathon negotiations, on Monday morning (13 July 2015), it appeared a deal had been reached. This deal is more or less the reform package demanded before the election (raising the pension age, raising the rate of VAT and other changes), but with one key addition. Greece will now be forced to place 50 billion euros worth of state owned assets into a fund. The fund will be managed by KfW, a German government owned development bank where German Finance Minister Wolfgang Schäuble is Chairman of the Board. Despite the apparent conflicts of interest, this setup is designed to allow the creditors to sell off those assets to pay off debt.
  • The deal has been been met with dismay by most people in Greece (and many observers). Immediately after the deal was announced, the number one trending hashtag worldwide was #ThisIsACoup.
  • The final hurdle at this stage is Greek Prime Minister Alexis Tsipras passing the needed reforms through the Greek parliament. Many members of his own party have already vowed to vote against the reforms. However, it is expected that with assistance from the other major parties, passage should be possible.
  • New elections are expected after the complete capitulation by Tsipras. Despite the apparent failure, many Greeks are behind their government, arguing that they at least made an honest attempt to improve the situation. However, once the new austerity measures are passed, the harsh reality is sure to hurt Syriza’s popularity. The tragedy of the situation is that it was a thinly veiled intention of European leaders to remove Syriza from power by humiliating the Greek people, and they look likely to succeed.

One interesting revelation that has come out in recent days is in relation to German Finance Minister Wolfgang Schäuble. What has become clear is that he has favored the path of forcing Greece out of the Eurozone entirely since at least 2012. Revelations from the 2014 memoir of US Treasury Secretary Timothy Geithner, Stress Test, have recently surfaced about a meeting in 2012 with Schäuble (emphasis mine):

“A few days later, I flew to meet Wolfgang Schäuble for lunch during his vacation at a resort in Sylt, a North Sea island known as Germany’s Martha’s Vineyard. Schäuble was engaging, but I left Sylt feeling more worried than ever. He told me there were many in Europe who still thought kicking the Greeks out of the eurozone was a plausible — even desirable — strategy. The idea was that with Greece out, Germany would be more likely to provide the financial support the eurozone needed because the German people would no longer perceive aid to Europe as a bailout for the Greeks. At the same time, a Grexit would be traumatic enough that it would help scare the rest of Europe into giving up more sovereignty to a stronger banking and fiscal union. The argument was that letting Greece burn would make it easier to build a stronger Europe with a more credible firewall. I found the argument terrifying,”

This insight into Schäuble’s thinking reveals the core issue at the heart of the shared currency zone –  Germany’s economic dominance. The Euro is essentially the new Deutschmark and this has a lot of side effects. Southern European nations benefit from being able to borrow at cheaper rates than they have historically, allowing governments to upgrade infrastructure and provide a stronger social safety net for their people. As it has turned out though, they also spent a lot of borrowed money on things that made them less competitive economically, such as large public sector salaries and very generous pension schemes.

Germany on the other hand benefits from having the Euro weighed down by those nations, making German exports extremely competitive internationally. It also benefits from the increased wealth of those southern European nations (even though it turned out to be mostly debt financed) who could spend more money on artificially cheap German exports.

Everyone was happy with the arrangement when things were going well, but when the crisis hit, the underlying inequalities were exposed. And despite the complex nature of the monetary union, there are only two basic ways the underlying structural issues in the shared currency zone can be resolved:

  1. Germany agrees to permanent and ongoing wealth transfers to the less efficient European nations in the same way richer states in the US subsidize poorer ones.
  2. Germany forces the rest of Europe to become more like Germany.

It is obvious which option appeals more to German politicians – convincing Germans to hand over their taxes to what they largely see as their lazy, poorly run neighbors is basically a non-starter.

Option 2 is more or less what has been happening and the results are clear – it caused huge economic disruption in those countries, particularly as the reforms were implemented during times of economic turmoil. But there is a fundamental question of democracy at play here. Obviously Greece (and to a lesser extent the rest of southern Europe) was not doing a particularly good job of managing its own economy. The question is are we OK with a world where unelected figures can force economic reforms on a country – even if they are beneficial in the long run – directly against the will of the people?

I will leave the final quote to Arnulf Baring, a German author and historian (amongst other things), who was strongly opposed to the introduction of the Euro. In his 1997 book, Scheitert Deutschland? (Does Germany Fail?), he made the following amazingly accurate prediction about the future of the Eurozone:

“They [populistic media and politicians] will say that we are subsidizing scroungers, lazing on mediterranean beaches. Monetary union, in the end, will result in a giant blackmailing operation. When we Germans demand monetary discipline, other countries will blame their financial woes on that same discipline, and by extension, on us. More, they will perceive us as a kind of economic policeman. We risk again becoming the most hated people in Europe.”


Update #1 – July 4, 2015

  • The latest polling on the referendum is showing that it is too close to call. Both sides are polling approximately 43% with about 14% of Greeks undecided as to which way they will vote.
  • Friday saw rallies in Athens for both campaigns ahead of a campaign free day on Saturday. Both had huge attendances but as one observer described: “[The] ‘NO’ rally is pure passion trying to look formal. ‘YES’ rally is something formal trying to look passionate.”
  • The Greek finance minister Yanis Varoufakis has declared that he would rather cut his arm off than accept a further bailout. Varoufakis confirmed Syriza would agree to the conditions of the bailout, should the ‘Yes’ campaign prevail, but also pledged to step down if this occurred.
  • The IMF on Thursday released a review of Greece’s debt, which many in the ‘No’ campaign are taking as a big win, given that the report includes an admission that Greece’s current debt is unsustainable. The report also revealed the ongoing disagreement between the IMF and Brussels regarding the best way forward for Greece. In apparent confirmation of the damage these revelations could cause, Eurozone countries are reported to have attempted to halt the release of the document before the referendum.

Original Piece – July 2, 2015

The debt crisis in Greece has been evolving quickly over the past few days, with several interesting developments. If this is the first you have heard about it or you haven’t been following the issue closely, I strongly recommend going back and starting here. For those that are up to date, here are the key updates so far this week:

  1. The European Central Bank (ECB) has not cut off emergency funding to banks in Greece as it was feared it might, but has decided against raising the amount of funding it will provide. The main story here is the banking sector in Greece avoids an immediate collapse and Greece will be able to survive until the referendum this weekend. But, by not raising the amount of funding, they have put Greek banks in a position where, if they ran in business-as-usual mode, they would not be able to keep up with the demand for Euro’s and would run out of cash.
  2. As a result, the Greek government has imposed capital controls and declared a bank holiday for this week. Banks will not open (with an exception for pensioners on Thursday) and people will only be able to take out 60 euros a day from ATMs. This is to ensure banks in Greece can stay viable until the referendum.
  3. In terms of the referendum, the expected result is unclear at this point. The latest polling is showing the ‘No’ (OXI) vote is ahead with 55% planning to vote ‘No’ to accepting the bailout under the current conditions, with only 33% planning to vote ‘Yes’ (NAI). But the gap has been closing as the situation has deteriorated. This picture contrasts with betting markets (yep, you can pretty much bet on anything) currently indicating a 66% chance of a ‘Yes’ vote.
  4. In the meantime, the Greek Prime Minister Alexis Tsipras has been campaigning strongly for a ‘No’ vote in the referendum. Tsipras is not out there on his own though. Two Nobel Laureates in Economics in Paul Krugman and Joseph Stiglitz have expressed their support for Syria’s decision and a ‘No’ vote, also adding a good helping of criticism for the role the creditors have played in getting to this point.
  5. However, in the meantime Syriza have still been attempting to continue negotiations with the creditors and yesterday (Wednesday) made further concessions in order to try to secure a deal.  The concessions made were agreeing to certain cuts to pensions (despite what you might have heard, the creditors are demanding further cuts) but on a delayed schedule, and agreeing to most of the VAT increases but maintaining an exemption for the islands. It should be noted that any deal reached at this point would not cancel the referendum, but would cause Syriza to reverse their current course and start campaigning for a ‘Yes’ vote.
  6. The creditors have basically slammed the door on further negotiations though, indicating that no further negotiations are possible before the referendum. This move is widely perceived as Europe calling Syriza’s bluff, but there is probably more to it than that. There have been further claims that no new deal is possible at all while Syriza remains in power. Indications are that regardless of the outcome of the referendum, the Eurozone will continue attempts to force new elections in Greece. Of course, this overlooks the fact that the only reason a marginal party like Syriza got into power in the first place was due to the extreme austerity forced upon Greece, but whatever. For outside observers, no matter what you think about who is to blame for this crisis, the completely undisguised attempts by Europe to destroy a democratically elected government because they don’t like their politics should make you very angry.
  7. Finally, based on the reaction from bond and equity markets this week, the financial contagion from a collapse in the Greek economy would appear to be limited. That said, the political contagion could live on for a long time. The behavior (see point above) of the institutions (and the people heading them) that are supposed to be run for the benefit of all Europeans has revealed how politicized they have become. Even in the scenario where Greece somehow stays in the Eurozone, significant damage has been done to the European project and to the goodwill that existed for it. If you haven’t already, I highly recommend reading Alexis Andreou’s fantastic insight into how a lot of young Europeans are likely to be feeling.

The situation is changing fairly rapidly at the moment, so I will continue to add updates here as things change.

Piketty Takes A Swing at Germany

Thomas Piketty, a French economist who found fame through his book Capital in the Twenty-First Century, recently conducted an interview with German magazine Die Zeit. After being translated, the transcript of the interview went viral with quotes showing up in the front pages of news sites all over the world. And for good reason, Piketty pulls no punches in his view of the crisis and the stupidity of ignoring the lessons of the past… again. This should be mandatory reading for anyone commenting on the crisis.

This version of the interview, which was originally in German, was translated by Gavin Schalliol. He has now taken down the translation while he sorts out copyright issues. Here is the full text:

DIE ZEIT: Should we Germans be happy that even the French government is aligned with the German dogma of austerity?

Thomas Piketty: Absolutely not. This is neither a reason for France, nor Germany, and especially not for Europe, to be happy. I am much more afraid that the conservatives, especially in Germany, are about to destroy Europe and the European idea, all because of their shocking ignorance of history.

ZEIT: But we Germans have already reckoned with our own history.

Piketty: But not when it comes to repaying debts! Germany’s past, in this respect, should be of great significance to today’s Germans. Look at the history of national debt: Great Britain, Germany, and France were all once in the situation of today’s Greece, and in fact had been far more indebted. The first lesson that we can take from the history of government debt is that we are not facing a brand new problem. There have been many ways to repay debts, and not just one, which is what Berlin and Paris would have the Greeks believe.

ZEIT: But shouldn’t they repay their debts?

Piketty: My book recounts the history of income and wealth, including that of nations. What struck me while I was writing is that Germany is really the single best example of a country that, throughout its history, has never repaid its external debt. Neither after the First nor the Second World War. However, it has frequently made other nations pay up, such as after the Franco-Prussian War of 1870, when it demanded massive reparations from France and indeed received them. The French state suffered for decades under this debt. The history of public debt is full of irony. It rarely follows our ideas of order and justice.

ZEIT: But surely we can’t draw the conclusion that we can do no better today?

Piketty: When I hear the Germans say that they maintain a very moral stance about debt and strongly believe that debts must be repaid, then I think: what a huge joke! Germany is the country that has never repaid its debts. It has no standing to lecture other nations.

ZEIT: Are you trying to depict states that don’t pay back their debts as winners?

Piketty: Germany is just such a state. But wait: history shows us two ways for an indebted state to leave delinquency. One was demonstrated by the British Empire in the 19th century after its expensive wars with Napoleon. It is the slow method that is now being recommended to Greece. The Empire repaid its debts through strict budgetary discipline. This worked, but it took an extremely long time. For over 100 years, the British gave up two to three percent of their economy to repay its debts, which was more than they spent on schools and education. That didn’t have to happen, and it shouldn’t happen today. The second method is much faster. Germany proved it in the 20th century. Essentially, it consists of three components: inflation, a special tax on private wealth, and debt relief.

ZEIT: So you’re telling us that the German Wirtschaftswunder [“economic miracle”] was based on the same kind of debt relief that we deny Greece today?

Piketty: Exactly. After the war ended in 1945, Germany’s debt amounted to over 200% of its GDP. Ten years later, little of that remained: public debt was less than 20% of GDP. Around the same time, France managed a similarly artful turnaround. We never would have managed this unbelievably fast reduction in debt through the fiscal discipline that we today recommend to Greece. Instead, both of our states employed the second method with the three components that I mentioned, including debt relief. Think about the London Debt Agreement of 1953, where 60% of German foreign debt was cancelled and its internal debts were restructured.

ZEIT: That happened because people recognized that the high reparations demanded of Germany after World War I were one of the causes of the Second World War. People wanted to forgive Germany’s sins this time!

Piketty: Nonsense! This had nothing to do with moral clarity; it was a rational political and economic decision. They correctly recognized that, after large crises that created huge debt loads, at some point people need to look toward the future. We cannot demand that new generations must pay for decades for the mistakes of their parents. The Greeks have, without a doubt, made big mistakes. Until 2009, the government in Athens forged its books. But despite this, the younger generation of Greeks carries no more responsibility for the mistakes of its elders than the younger generation of Germans did in the 1950s and 1960s. We need to look ahead. Europe was founded on debt forgiveness and investment in the future. Not on the idea of endless penance. We need to remember this.

ZEIT: The end of the Second World War was a breakdown of civilization. Europe was a killing field. Today is different.

Piketty: To deny the historical parallels to the postwar period would be wrong. Let’s think about the financial crisis of 2008/2009. This wasn’t just any crisis. It was the biggest financial crisis since 1929. So the comparison is quite valid. This is equally true for the Greek economy: between 2009 and 2015, its GDP has fallen by 25%. This is comparable to the recessions in Germany and France between 1929 and 1935.

ZEIT: Many Germans believe that the Greeks still have not recognized their mistakes and want to continue their free-spending ways.

Piketty: If we had told you Germans in the 1950s that you have not properly recognized your failures, you would still be repaying your debts. Luckily, we were more intelligent than that.

ZEIT: The German Minister of Finance, on the other hand, seems to believe that a Greek exit from the Eurozone could foster greater unity within Europe.

Piketty: If we start kicking states out, then the crisis of confidence in which the Eurozone finds itself today will only worsen. Financial markets will immediately turn on the next country. This would be the beginning of a long, drawn-out period of agony, in whose grasp we risk sacrificing Europe’s social model, its democracy, indeed its civilization on the altar of a conservative, irrational austerity policy.

ZEIT: Do you believe that we Germans aren’t generous enough?

Piketty: What are you talking about? Generous? Currently, Germany is profiting from Greece as it extends loans at comparatively high interest rates.

ZEIT: What solution would you suggest for this crisis?

Piketty: We need a conference on all of Europe’s debts, just like after World War II. A restructuring of all debt, not just in Greece but in several European countries, is inevitable. Just now, we’ve lost six months in the completely intransparent negotiations with Athens. The Eurogroup’s notion that Greece will reach a budgetary surplus of 4% of GDP and will pay back its debts within 30 to 40 years is still on the table. Allegedly, they will reach one percent surplus in 2015, then two percent in 2016, and three and a half percent in 2017. Completely ridiculous! This will never happen. Yet we keep postponing the necessary debate until the cows come home.

ZEIT: And what would happen after the major debt cuts?

Piketty: A new European institution would be required to determine the maximum allowable budget deficit in order to prevent the regrowth of debt. For example, this could be a commmittee in the European Parliament consisting of legislators from national parliaments. Budgetary decisions should not be off-limits to legislatures. To undermine European democracy, which is what Germany is doing today by insisting that states remain in penury under mechanisms that Berlin itself is muscling through, is a grievous mistake.

ZEIT: Your president, François Hollande, recently failed to criticize the fiscal pact.

Piketty: This does not improve anything. If, in past years, decisions in Europe had been reached in more democratic ways, the current austerity policy in Europe would be less strict.

ZEIT: But no political party in France is participating. National sovereignty is considered holy.

Piketty: Indeed, in Germany many more people are entertaining thoughts of reestablishing European democracy, in contrast to France with its countless believers in sovereignty. What’s more, our president still portrays himself as a prisoner of the failed 2005 referendum on a European Constitution, which failed in France. François Hollande does not understand that a lot has changed because of the financial crisis. We have to overcome our own national egoism.

ZEIT: What sort of national egoism do you see in Germany?

Piketty: I think that Germany was greatly shaped by its reunification. It was long feared that it would lead to economic stagnation. But then reunification turned out to be a great success thanks to a functioning social safety net and an intact industrial sector. Meanwhile, Germany has become so proud of its success that it dispenses lectures to all other countries. This is a little infantile. Of course, I understand how important the successful reunification was to the personal history of Chancellor Angela Merkel. But now Germany has to rethink things. Otherwise, its position on the debt crisis will be a grave danger to Europe.

ZEIT: What advice do you have for the Chancellor?

Piketty: Those who want to chase Greece out of the Eurozone today will end up on the trash heap of history. If the Chancellor wants to secure her place in the history books, just like [Helmut] Kohl did during reunification, then she must forge a solution to the Greek question, including a debt conference where we can start with a clean slate. But with renewed, much stronger fiscal discipline.

« Older posts

© 2024 Brett Romero

Theme by Anders NorenUp ↑