
For the last 5 years, data science has been one of the world’s hottest professions, but it is also one of the most poorly defined. This can be seen on any career website, where advertisements for ‘Data Scientist’ positions describe everything from what used to be a simple data analyst role, to technical, PhD-only, research positions working on artificial intelligence or autonomous cars.
However, despite the diversity of roles being labelled ‘data scientist’, there is a common thread that runs through any job involving data and building models. And this is that only around 20% of time will be spent building models, with the other 80% of the time spent understanding, cleaning and transforming data to get it to the point where it can be used for modelling (for an overview of all the steps a Data Scientist goes through, see this series).
For many/most people working in the profession, the time spent cleaning and transforming is seen simply as a price to be paid to get to the interesting part – the modelling. If they could, many people would happily hand off this ‘grunt work’ to someone else. At first glance, it is easy to see why this would be the case – it is the modelling that gets all the headlines. There are very few people that hear about a model predicting cancer in hospital patients and thinks “they must have had some awesome clean data to build that with”.
However, plaudits aside, I am going to make the case that this is backwards. That from a creativity and challenge standpoint, it is often the cleaning and transforming parts of the job that are the most interesting parts of data science.
The creativity of cleaning
Over the past 12 years of working with data, one thing that has become painfully obvious is the unbridled creativity of people when it comes to introducing errors and inconsistencies into data. Typos, missing values, numbers in text fields, text in numerical fields, inconsistent spellings of the same item, and changing number formats (e.g. ever notice how most of continental Europe uses “,” as the decimal point instead of “.”?) are just some of the most common issues one will encounter.
To be fair, it is not only the fault of the person doing the data entry (e.g. an end user of an application). Often, the root of the problem is a poorly designed interface and a lack of data validation. For example, why is a user able to submit text in a field that should only ever contain numbers? Why do I have to guess how everyone else types in “the United States” (US, U.S., USA, U.S.A., United States of America, America, Murica) instead of choosing from a standardized list of countries?
However, even with the most carefully validated forms and data entry interface, data quality issues will continue to exist. People fudge their age, lie about their income, enter fake emails, addresses and names, and some, I assume, make honest typos and mistakes.
So why is dealing with these issues is a good thing? Because the unlimited creativity on the part of the people creating the data quality issues has to be exceeded by the creativity of the person cleaning the data. For every possible type of error that can be found in the data, the data scientist has to develop a method to address that error. And assuming the dataset is more than a few hundred rows, it will have to be a systematic method, as manually correcting the issues becomes impractical.
As a result, the data scientist has to find a way to address the universe of potential errors, and to do so in an automated, systematic way. How do I go through a column of countries that have all been spelt in different ways in order to standardize the country names? Someone got decimal happy and now I have a column where a lot of the numbers have two decimal points instead of one – how can I systematically work out which decimal point is the correct one, and then remove the other decimal point? A bunch of users put their birthday as 1 January 1900, how can I remove those, should I remove them, and if yes, what values should I put there instead?
All of these scenarios are real examples of interesting, challenging problems to solve, and ones that require a high-level of creativity to address.
The creativity of transformation/feature extraction
Once cleaning has been undertaken, typically the next step is to perform transformation and/or feature extraction. These steps are necessary because the data is rarely collected in the form required by the model, and/or there is additional information that can be added to and/or extracted from the data to make the model more effective.
If this sounds like a very open ended task, that’s because it is. Often, the ability to enhance a dataset is limited only by time, and the creativity and knowledge of the data scientist doing the work. Of course, there are diminishing returns, and at some point, it becomes uneconomic to invest additional effort to improve a dataset, but in many cases there are a huge range of options.
Due to the open-ended nature of this step, there are actually two types of creativity required. The first is the creativity to come up with potential new features that can be extracted from the existing dataset (and developing the methods to create those features). The second is identifying other data that could be used to enhance the dataset (and then developing the methods to import and combine it). Again, both of these are challenging and interesting problems to solve.
Making a model is often a mechanical process
Unlike the above, the process of creating the model is a relatively mechanical process. Of course, there are still challenges to overcome, but in most cases, it boils down to choosing an algorithm (or combination of algorithms), then tuning the parameters to improve the results. The issue is that both of these steps are not something that typically involve a lot of creative thinking, but instead involve cycling through a lot of options to see what works.
Even the selection of the algorithm, or combination of algorithms, which might seem relatively open ended, is, in the real world, limited by a range of factors. For a given problem, these factors include:
- The task at hand – whether it be two-class or multi-class classification, cluster analysis, prediction of a continuous variable, or something else – will reduce the algorithm options. Some algorithms will typically perform better in certain scenarios, while others may simply not be able to handle the task at all.
- The characteristics of the data often also reduces the options. Larger datasets mean some algorithms will take too long to train to be practical. Datasets with large numbers of features suit some algorithms more than others, while sparse datasets (those with lots of 0 values) will suit other algorithms.
- An often-overlooked factor is the ability to explain to clients and/or bosses how and why a model is making a prediction. Being able to do this typically puts a significant limit on the complexity of the model (particularly ensembles), and makes simpler (and often less accurate) models more appealing.
After all these factors are taken into account, how many algorithms are left to choose from in a given scenario? Probably not too many.

An excellent graphic from SAS summarizing how the algorithm choices in data science are often limited by the problem.
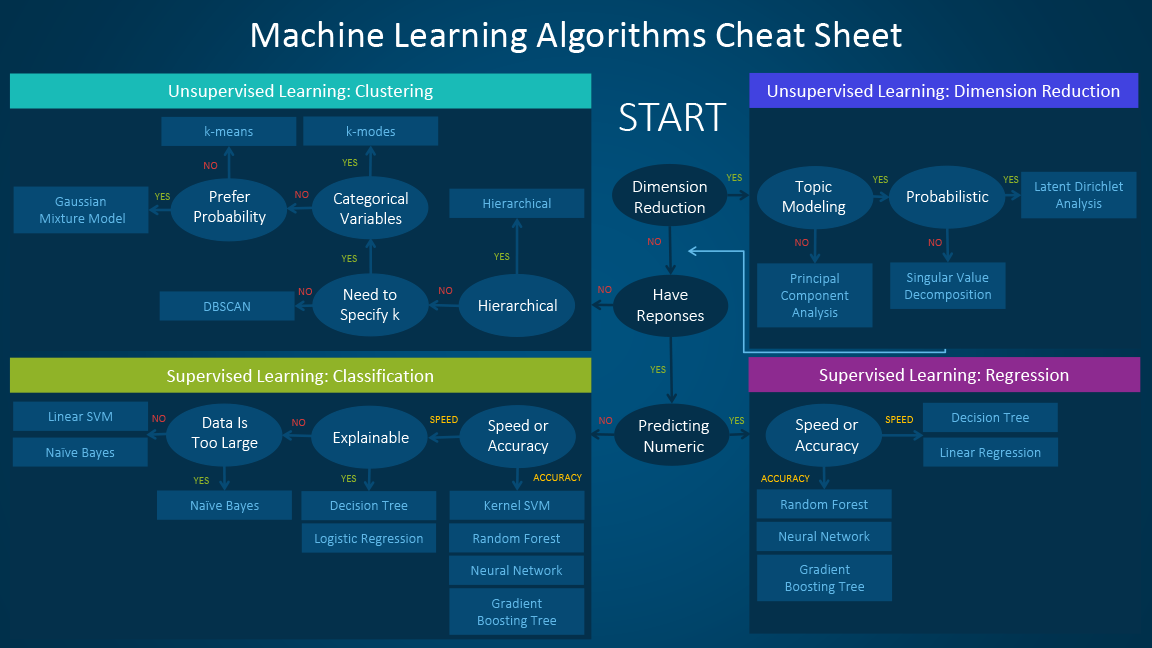
Wrapping Up
Taking all the above into account, the picture that starts to form is one where significant creativity is required to clean and create a good dataset for modelling, followed by a relatively mechanical process to create and tune a model. But if this is the case, why doesn’t everyone think the same way I do?
One of the primary reasons is that in most real-world data science scenarios, the above steps (cleaning, transformation, feature extraction and modelling) are not typically conducted in a strictly linear fashion. Often, building the model and assessing which features were the most predictive will lead to additional work transforming and extracting features. Feature extraction and testing a model will often reveal data quality issues that were missed earlier and cause the data scientist to revisit that step to address those issues.
In other words, in practice everything is interlinked and many data scientists view the various steps in the process of constructing a model (including cleaning and transforming) as one holistic process that they enjoy completing. However, because the cleaning and transforming aspects are the most time consuming, these aspects (data cleaning in particular) are often seen as being the major impediment to a completed project.
This is true – almost all projects could be completed significantly quicker if the data was of a higher quality at the outset. The quick turnaround for most Kaggle competition entries (where relatively clean and standardized data are provided to everyone) can attest to this. But to my fellow data scientists, I would say the following. Data science will always involve working with dirty and underdeveloped data – no matter how good we get at data validation, how clean and intuitive the interface, or how much planning is done on what data points to collect. Embrace the dirt, celebrate the grind, and take pride in creating creative solutions to often complex and challenging problems. If you don’t, no one else will.
Good insights and perspectives here. I’m retweeting this 🙂