
This article is part of a series of practical guides for using the Python data processing library pandas. To see view all the available parts, click here.
When we are working with data in software development or when the data comes from APIs, it is often not provided in a tabular form. Instead it is provided in some combination of key-value stores and arrays broadly denoted as JavaScript Object Notation (JSON). So how do we read this type of non-tabular data into a tabular format like a pandas DataFrame?
Understanding Structures
The first thing to understand about data stored in this form is that there are effectively infinite ways to represent a single dataset. For example, take a simple dataset, shown here in tabular form:
| id | department | first_name | last_name |
|---|---|---|---|
| 1 | Sales | John | Johnson |
| 2 | Sales | Peter | Peterson |
| 3 | Sales | Paula | Paulson |
| 4 | HR | James | Jameson |
| 5 | HR | Jennifer | Jensen |
| 6 | Accounting | Susan | Susanson |
| 7 | Accounting | Clare | Clareson |
Let’s look at some of the more common ways this data might be represented using JSON:
1. “Records”
A list of objects, with each object representing a row of data. The column names are the keys of each object.
[
  {
    "department": "Sales",
    "first_name": "John",
    "id": 1,
    "last_name": "Johnson"
  },
  {
    "department": "Sales",
    "first_name": "Peter",
    "id": 2,
    "last_name": "Peterson"
  },
  {
    "department": "Sales",
    "first_name": "Paula",
    "id": 3,
    "last_name": "Paulson"
  },
  ...
]
2. “List”
An object where each key is a column, with the values for that column stored in a list.
{
  "id": [
    1,
    2,
    3,
    4,
    5,
    6,
    7
  ],
  "department": [
    "Sales",
    "Sales",
    "Sales",
    "HR",
    "HR",
    "Accounting",
    "Accounting"
  ],
  "first_name": [
    "John",
    "Peter",
    "Paula",
    "James",
    "Jennifer",
    "Susan",
    "Clare"
  ],
  "last_name": [
    "Johnson",
    "Peterson",
    "Paulson",
    "Jameson",
    "Jensen",
    "Susanson",
    "Clareson"
  ]
}
3. “Split”
An object with two keys, one for the column names, the other for the data which is a list of lists representing rows of data.
{
  "columns": [
    "id",
    "department",
    "first_name",
    "last_name"
  ],
  "data": [
    [
      1,
      "Sales",
      "John",
      "Johnson"
    ],
    [
      2,
      "Sales",
      "Peter",
      "Peterson"
    ],
  ...
  ]
}
Creating a DataFrame
So how do we get this data into a pandas DataFrame given that it could come in different forms? The key is knowing what structures pandas understands. In the first two cases above (#1 Records and #2 List), pandas understands the structure and will automatically convert it to a DataFrame for you. All you have to is pass the structure to the DataFrame class:
list_data = {
  "id": [
    1,
    2,
    3,
    4,
    5,
    6,
    7
  ],
  "department": [
    "Sales",
    "Sales",
    "Sales",
    "HR",
    "HR",
    "Accounting",
    "Accounting"
  ],
  "first_name": [
    "John",
    "Peter",
    "Paula",
    "James",
    "Jennifer",
    "Susan",
    "Clare"
  ],
  "last_name": [
    "Johnson",
    "Peterson",
    "Paulson",
    "Jameson",
    "Jensen",
    "Susanson",
    "Clareson"
  ]
}
df = pd.DataFrame(list_data)
print(df)

	id 	department     first_name 	last_name
0 	1 	Sales 	       John 	        Johnson
1 	2 	Sales 	       Peter 	        Peterson
2 	3 	Sales 	       Paula 	        Paulson
3 	4 	HR 	       James 	        Jameson
4 	5 	HR 	       Jennifer 	Jensen
5 	6 	Accounting     Susan 	        Susanson
6 	7 	Accounting     Clare 	        Clareson
Initializing a DataFrame this way also gives us a couple of options. We can load in only a selection of columns:
df = pd.DataFrame(list_data, columns=['id', 'department])
print(df)

	id 	department
0 	1 	Sales
1 	2 	Sales
2 	3 	Sales
3 	4 	HR
4 	5 	HR
5 	6 	Accounting
6	7 	Accounting
We can also define an index. However, if one of the fields in your dataset is what you want to set as the index, it is simpler to do so after you load the data into a DataFrame:
df = pd.DataFrame(list_data).set_index('id')
print(df)

    department first_name last_name
id
1        Sales       John   Johnson
2        Sales      Peter  Peterson
3        Sales      Paula   Paulson
4           HR      James   Jameson
5           HR   Jennifer    Jensen
6   Accounting      Susan  Susanson
7   Accounting      Clare  Clareson
Acceptable Structures
What are the acceptable structures that pandas recognizes? Here are the ones I have found so far:
Records
[
  {
    "department": "Sales",
    "first_name": "John",
    "id": 1,
    "last_name": "Johnson"
  },
  {
    "department": "Sales",
    "first_name": "Peter",
    "id": 2,
    "last_name": "Peterson"
  },
  {
    "department": "Sales",
    "first_name": "Paula",
    "id": 3,
    "last_name": "Paulson"
  },
  ...
]
List
{
  "id": [
    1,
    2,
    3,
    4,
    5,
    6,
    7
  ],
  "department": [
    "Sales",
    "Sales",
    "Sales",
    "HR",
    "HR",
    "Accounting",
    "Accounting"
  ],
  "first_name": [
    "John",
    "Peter",
    "Paula",
    "James",
    "Jennifer",
    "Susan",
    "Clare"
  ],
  "last_name": [
    "Johnson",
    "Peterson",
    "Paulson",
    "Jameson",
    "Jensen",
    "Susanson",
    "Clareson"
  ]
}
Dict
{
  "id": {
      0: 1,
      1: 2,
      2: 3,
      3: 4,
      4: 5,
      5: 6,
      6: 7
  },
  "department": {
    0: "Sales",
    1: "Sales",
    2: "Sales",
    3: "HR",
    4: "HR",
    5: "Accounting",
    6: "Accounting"
  },
  "first_name": {
    0: "John",
    1: "Peter",
    2: "Paula",
    3: "James",
    4: "Jennifer",
    5: "Susan",
    6: "Clare"
  },
  "last_name": {
    0: "Johnson",
    1: "Peterson",
    2: "Paulson",
    3: "Jameson",
    4: "Jensen",
    5: "Susanson",
    6: "Clareson"
  }
}
Matrix
For this one you will have to pass the column names separately.
[
    [
        1,
        "Sales",
        "John",
        "Johnson"
    ],
    [
        2,
        "Sales",
        "Peter",
        "Peterson"
    ],
    [
        3,
        "Sales",
        "Paula",
        "Paulson"
    ],
    ...
]
Inconsistencies
What happens if the data is in one of these formats, but has some inconsistencies? For example, what if we have something that looks like this?
[
  {
    "department": "Sales",
    "first_name": "John",
    "id": 1,
    "last_name": "Johnson",
    "extra_field": "woops!"
  },
  {
    "department": "Sales",
    "first_name": "Peter",
    "id": 2,
    "last_name": "Peterson"
  },
  {
    "department": "Sales",
    "first_name": "Paula",
    "id": 3,
    "last_name": "Paulson"
  },
  ...
]
Fortunately, pandas is fairly robust to these types of inconsistencies, in this case creating an extra column and filling the remaining rows with NaN (null values):
    id  department  first_name  last_name  extra_field
0   1   Sales 	    John 	Johnson    woops!
1   2   Sales 	    Peter 	Peterson   NaN
2   3   Sales 	    Paula 	Paulson    NaN
3   4   HR 	    James 	Jameson    NaN
4   5   HR 	    Jennifer 	Jensen     NaN
5   6   Accounting  Susan       Susanson   NaN
6   7   Accounting  Clare       Clareson   NaN
Something important to note is that, depending on the structure and where the inconsistency occurs in the structure, the inconsistency can be handled differently. It could be an additional column, an additional row, or in some cases it may be ignored completely. The key is, as always, to check your data has loaded as expected.
Explicit Methods
There are two more methods for reading JSON data into a DataFrame: DataFrame.from_records and DataFrame.from_dict. DataFrame.from_records expects data in the ‘Records’ or ‘Matrix’ formats shown above, while DataFrame.from_dict will accept data in either the Dict or List structures. These methods are more explicit in what they do and have several potential advantages:
Clarity
When working with a team or in a situation where other people are going to review your code, being explicit can help them to understand what you are trying to do. Passing some unknown structure to DataFrame and knowing/hoping it will interpret it correctly is using a little too much ‘magic’ for some people. For the sanity of others, and yourself in 6 months when you are trying to work out what you did, you might want to consider the more explicit methods.
Strictness
When writing code that is going to be reused, maintained and/or run automatically, we want to write that code in a very strict way. That is, it should not keep working if the inputs change. Using DataFrame could lead to situations where the input data format changes, but is read in anyway and instead breaks something else further down the line. In a situation like this, someone will likely have the unenviable task of following the trail through the code to work out what changed.
Using the more explicit methods is more likely to cause the error to be raised where the problem actually occurred: reading in data which is no longer in the expected format.
Options
The more explicit methods give you more options for reading in the data. For example DataFrame.from_records gives you options to limit the number of rows to read in. DataFrame.from_dict allows you to specify the orientation of the data. That is, are the lists of values representative of columns or rows?
Coercion
In some cases, your data will not play nice and the generic DataFrame method will not correctly interpret your data. Using the more explicit method can help to resolve this. For example, if your objects are in a column of a DataFrame (i.e. a pandas Series) instead of a list, using DataFrame will give you a DataFrame with one column:
records_data = pd.Series([
  {
    "department": "Sales",
    "first_name": "John",
    "id": 1,
    "last_name": "Johnson",
    "test": 0
  },
  {
    "department": "Sales",
    "first": "Peter",
    "id": 2,
    "name": "Peterson"
  },
  {
    "dept": "Sales",
    "firstname": "Paula",
    "sid": 3,
    "lastname": "Paulson"
  },
  {
    "dept": "HR",
    "name": "James",
    "pid": 4,
    "last": "Jameson"
  }
])
print(pd.DataFrame(records_data))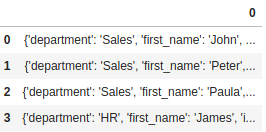
Using the more explicit DataFrame.from_records gives you the expected results:
records_data = pd.Series([
  {
    "department": "Sales",
    "first_name": "John",
    "id": 1,
    "last_name": "Johnson",
    "test": 0
  },
  {
    "department": "Sales",
    "first": "Peter",
    "id": 2,
    "name": "Peterson"
  },
  {
    "dept": "Sales",
    "firstname": "Paula",
    "sid": 3,
    "lastname": "Paulson"
  },
  {
    "dept": "HR",
    "name": "James",
    "pid": 4,
    "last": "Jameson"
  }
])
print(pd.DataFrame.from_records(records_data))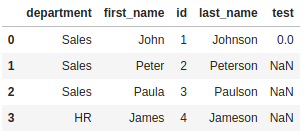
Wrapping Up
We’ve looked at how we can quickly and easily convert JSON format data into tabular data using the DataFrame class and the more explicit DataFrame.from_records and DataFrame.from_dict methods. The downside is this only works if the data is in one of a few structures. The upside is most of the data you will encounter will be in one of these formats, or something that is easily converted into these formats.
If you want to play around with converting data between delimited format and various JSON formats, I can recommend trying an app I built a while back: JSONifyit.
0 Comments
2 Pingbacks