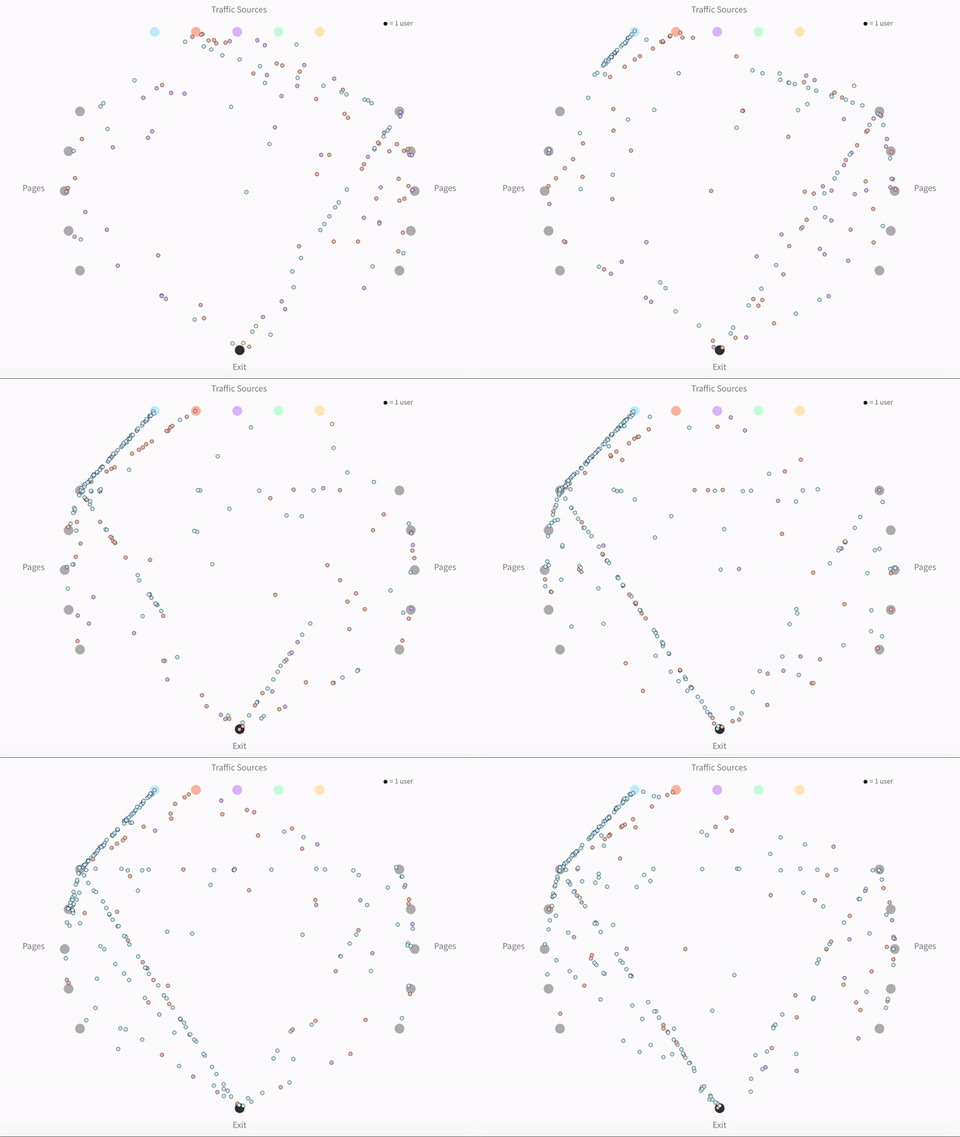
I am proud to announce the release of an application I’ve been working on for the last few months – Visual Analytics. This application is designed to give you a new way to view your Google Analytics data using a range of interactive visualizations, allowing you to get a better understanding of who your users are, how they are getting to your site, and what they are doing when they get there.

For those worried about privacy and personal security, the application has a couple of features that will hopefully ease your mind. Firstly, there is no separate account or login details needed for Visual Analytics, everything is based on your existing Google account, and the login process is completed using Google authentication.

Secondly, the application does not currently store any user data. In fact, the application has no database at all (sensing a theme here?). That means that not only does that mean I can not sell your data to third parties, but that even if someone does manage to hack into the application, there is nothing to steal except my hacky code base.
For those interested in the technical specs, the backend of the application was built using Python and the Flask web framework. To access the data, once you are logged in using your Google credentials, the application makes calls to the Google Analytics API and then uses Pandas to handle the data manipulation (where needed). On the front end, the visualizations are created using D3.js and Highcharts (a big shout out to the Highcharts team and Mike Bostock for their excellent work on these libraries).
Anyway, if you have a Google Analytics account and are interested in getting some interesting insights into your data, take a look and let me know what you think. And please, if you find an issue or a bug, let me know!

Leave a Reply